




Ask a strong correspondence player how decisive games above 2400 end these days and the usual answer is that somebody’s clock ran out. Put as a claim that can be tested, the belief is that among games where both players are rated at least 2400, more than half of decisive results are administrative rather than decided over the board.
On settled data for 2021–22 the administrative share at 2400 and above is 42.5%, with a 95% confidence interval of 37.6% to 47.6% (that is, the true share very likely lies in that range). Later intervals appear in square brackets after the figure they belong to. Nearly three in five decisive games at that level are still lost on the board.
The belief points in the right direction, though. The administrative share was 9.6% in 2012–14, then 14.8%, then 22.6%, then 42.5%, more than quadrupling in a decade. Correspondence chess at the top is becoming a test of who keeps submitting moves, and the useful question, which the data can answer, is how far along that road it has got.
The other common belief is that the draw rate at the top has levelled off, whether over time or across ratings. Everything here is measured on start years, and only on years through 2022, the last whose games have stopped arriving in meaningful numbers; Section 5 explains why. On those years the draw rate has not levelled off in any band, and it keeps rising as you go up the rating list.
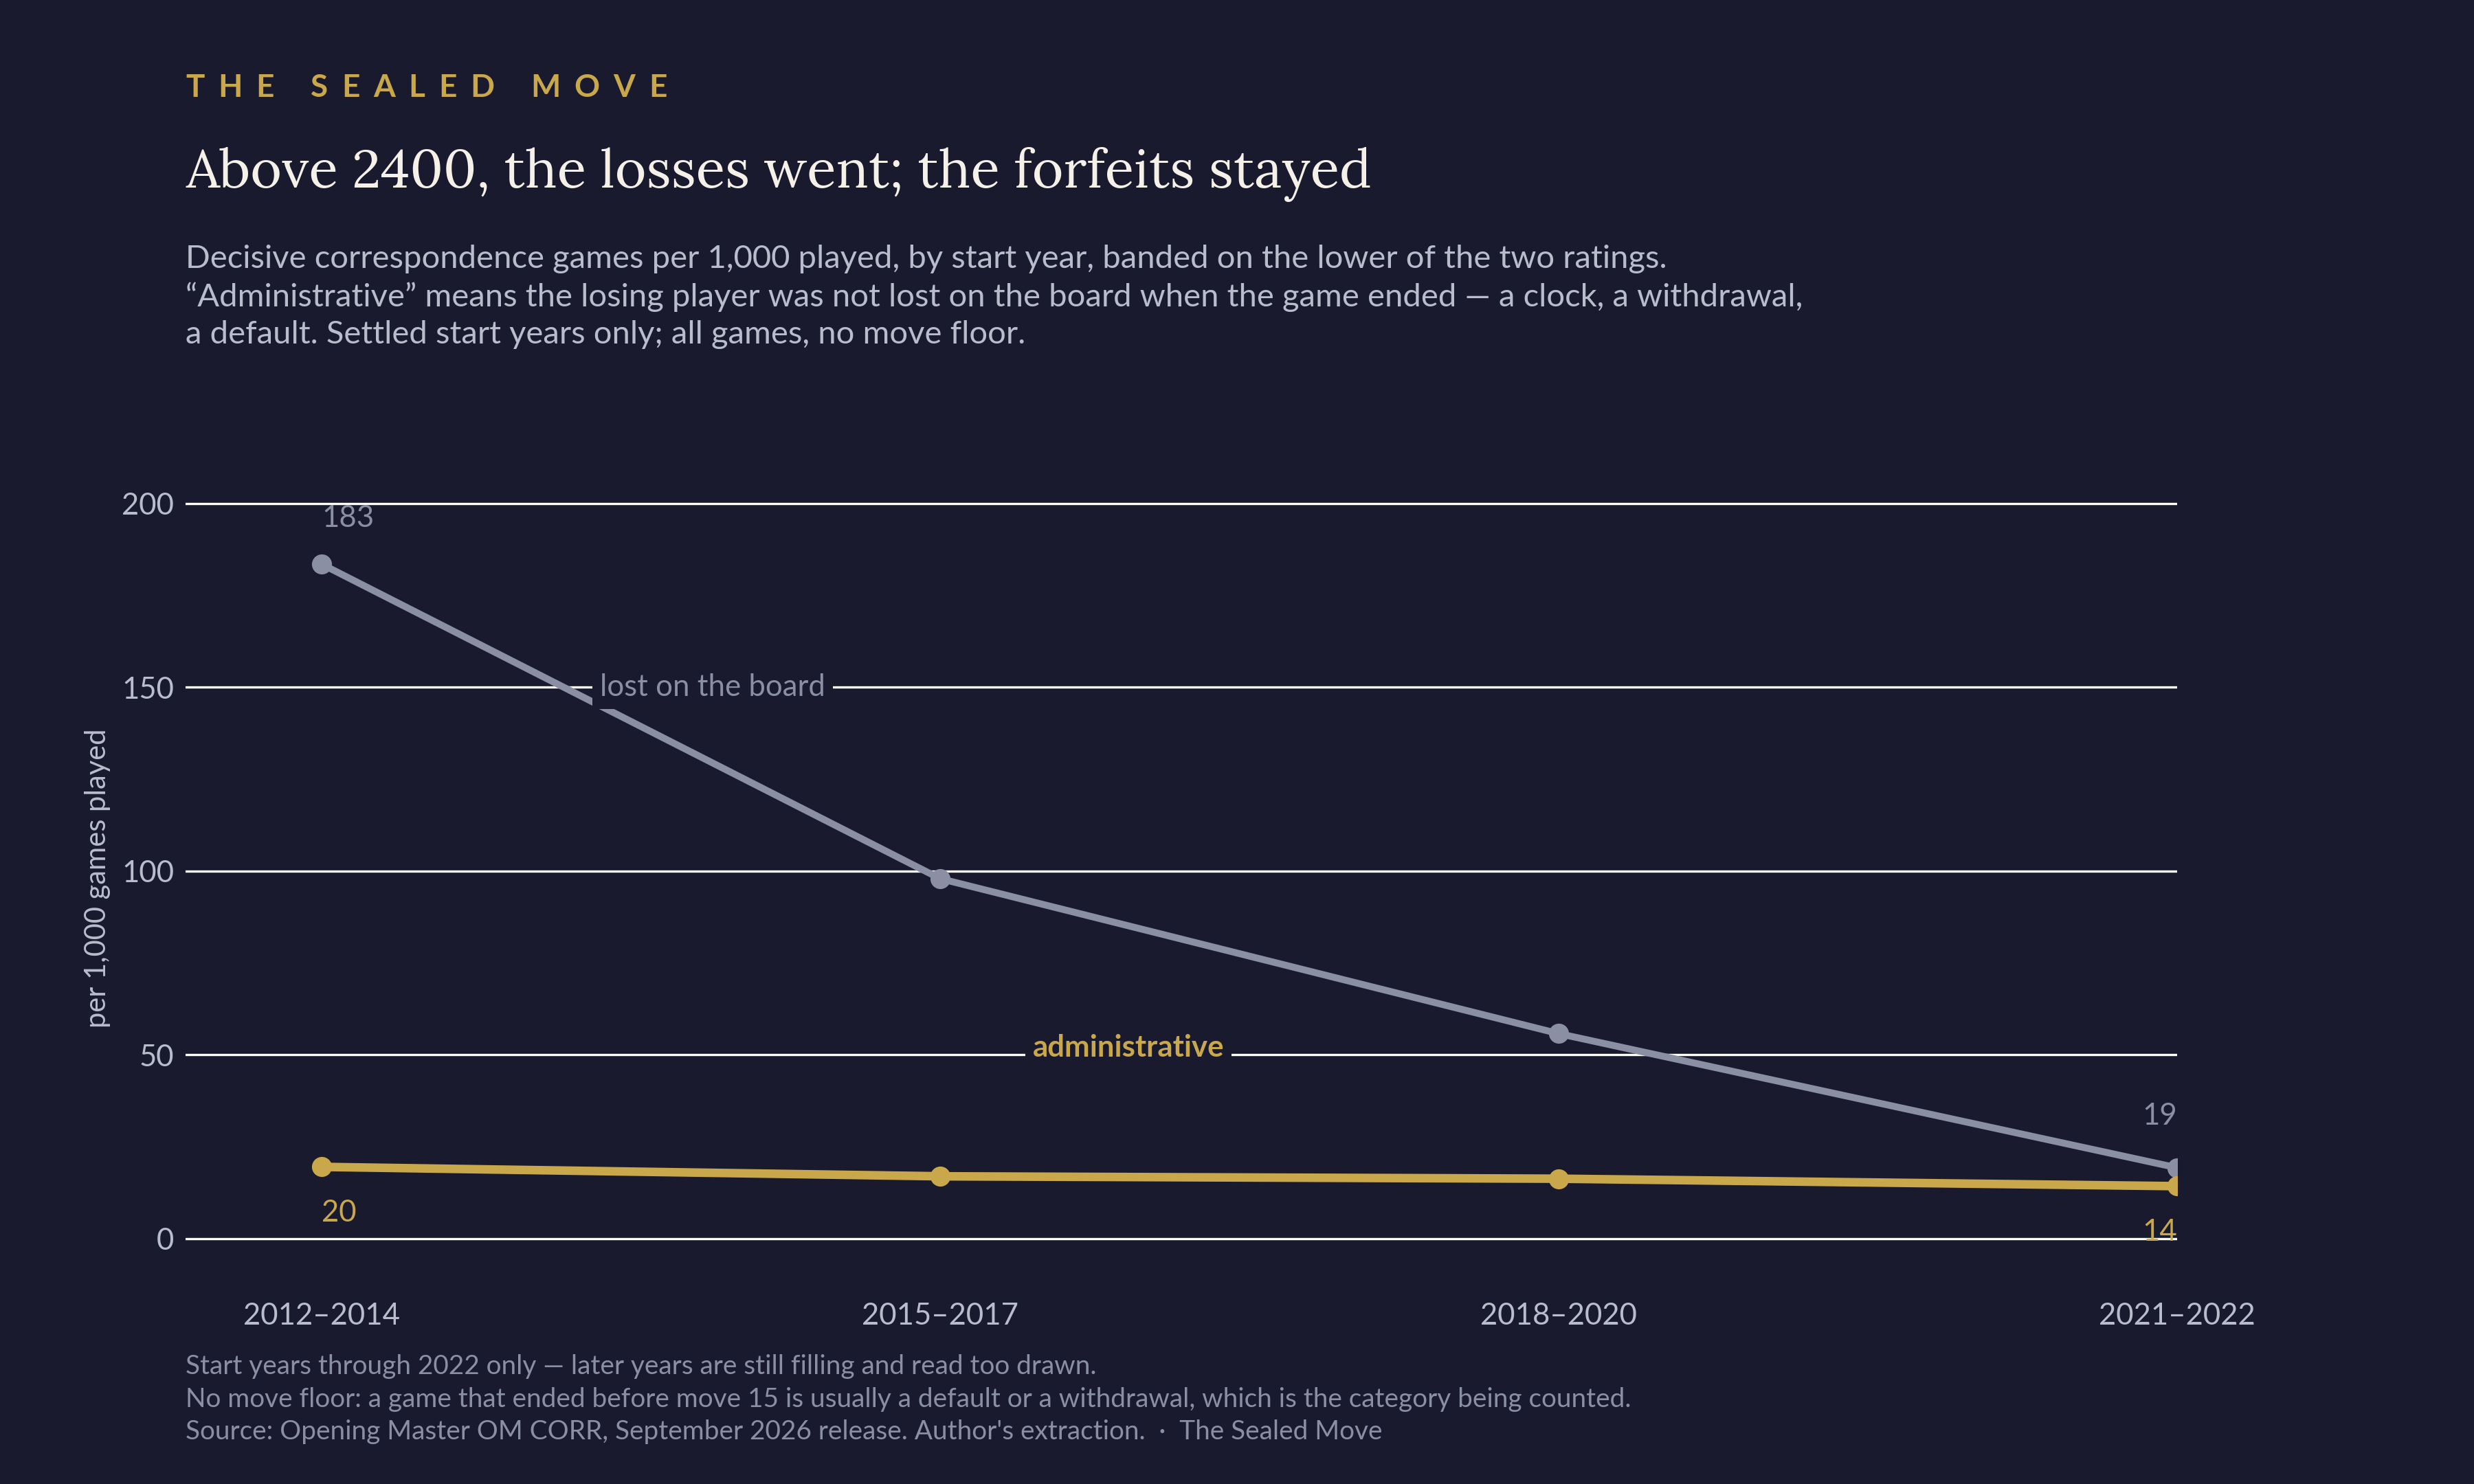
The measurement that settles both is to split decisive games by whether the loser was lost on the board, and to count each kind per thousand games played. Above 2400, over the decade to 2022, losses on the board fell by 89.5%, from 183.5 per thousand to 19.3. Administrative terminations went from 19.5 to 14.3, a decline a trend test cannot distinguish from flat in any rating group.
Because the administrative rate shows no measurable decline, it can be treated as a floor, and a floor can be measured directly. It caps the draw rate at 97.7% to 98.4%, against an observed 96.6% in 2021–22, which leaves between one and two points of headroom for the draw rate to keep rising.
The board losses that remain have changed character as well. One in five is now a game played cleanly up to a single catastrophic move, against one in fifty-five a decade ago. That is a share of a shrinking total: counted per thousand games played, such collapses show no trend that survives a change of threshold.
1. The draw rate has not levelled off
The usual view at the top of correspondence chess is that the draw rate has levelled off: somewhere above 2400 it has reached its ceiling, and the decisive games left over are administrative. Both of us have published work that implied as much. The data contradicts this view whether you look for the plateau over time or across ratings.
On settled start years from 2015 to 2022, counting every game with no move floor, the draw rate rises in every band with enough games to measure, as Figure 1 shows:
2200-2299: +2.40 percentage points a year [+2.03, +2.77]
2300-2399: +2.28 [+2.06, +2.51]
2400-2499: +1.68 [+1.37, +1.99]
All three at p<0.0001: if the draw rate were not rising, a trend this steep would turn up by chance less than once in ten thousand samples of this size. The top band rises more slowly than the bands below it, as you would expect of a quantity nearer its bound, and it still gains more than a point and a half a year.
Across ratings, pooled over settled years 2018 to 2022, 2400-2499 draws 93.99% [93.70, 94.28] of 25,904 games and 2500-2599 draws 95.74% [95.05, 96.34] of 3,612. The stronger band draws 1.75 points more often, p=0.00003, so the rate keeps climbing with strength too.
Above 2600 there is too little to work with. The whole database holds 373 decisive games at 2600+, six of them in 2025, so it gets no series of its own. Its games sit inside the 2400+ figures, where they are a small share.
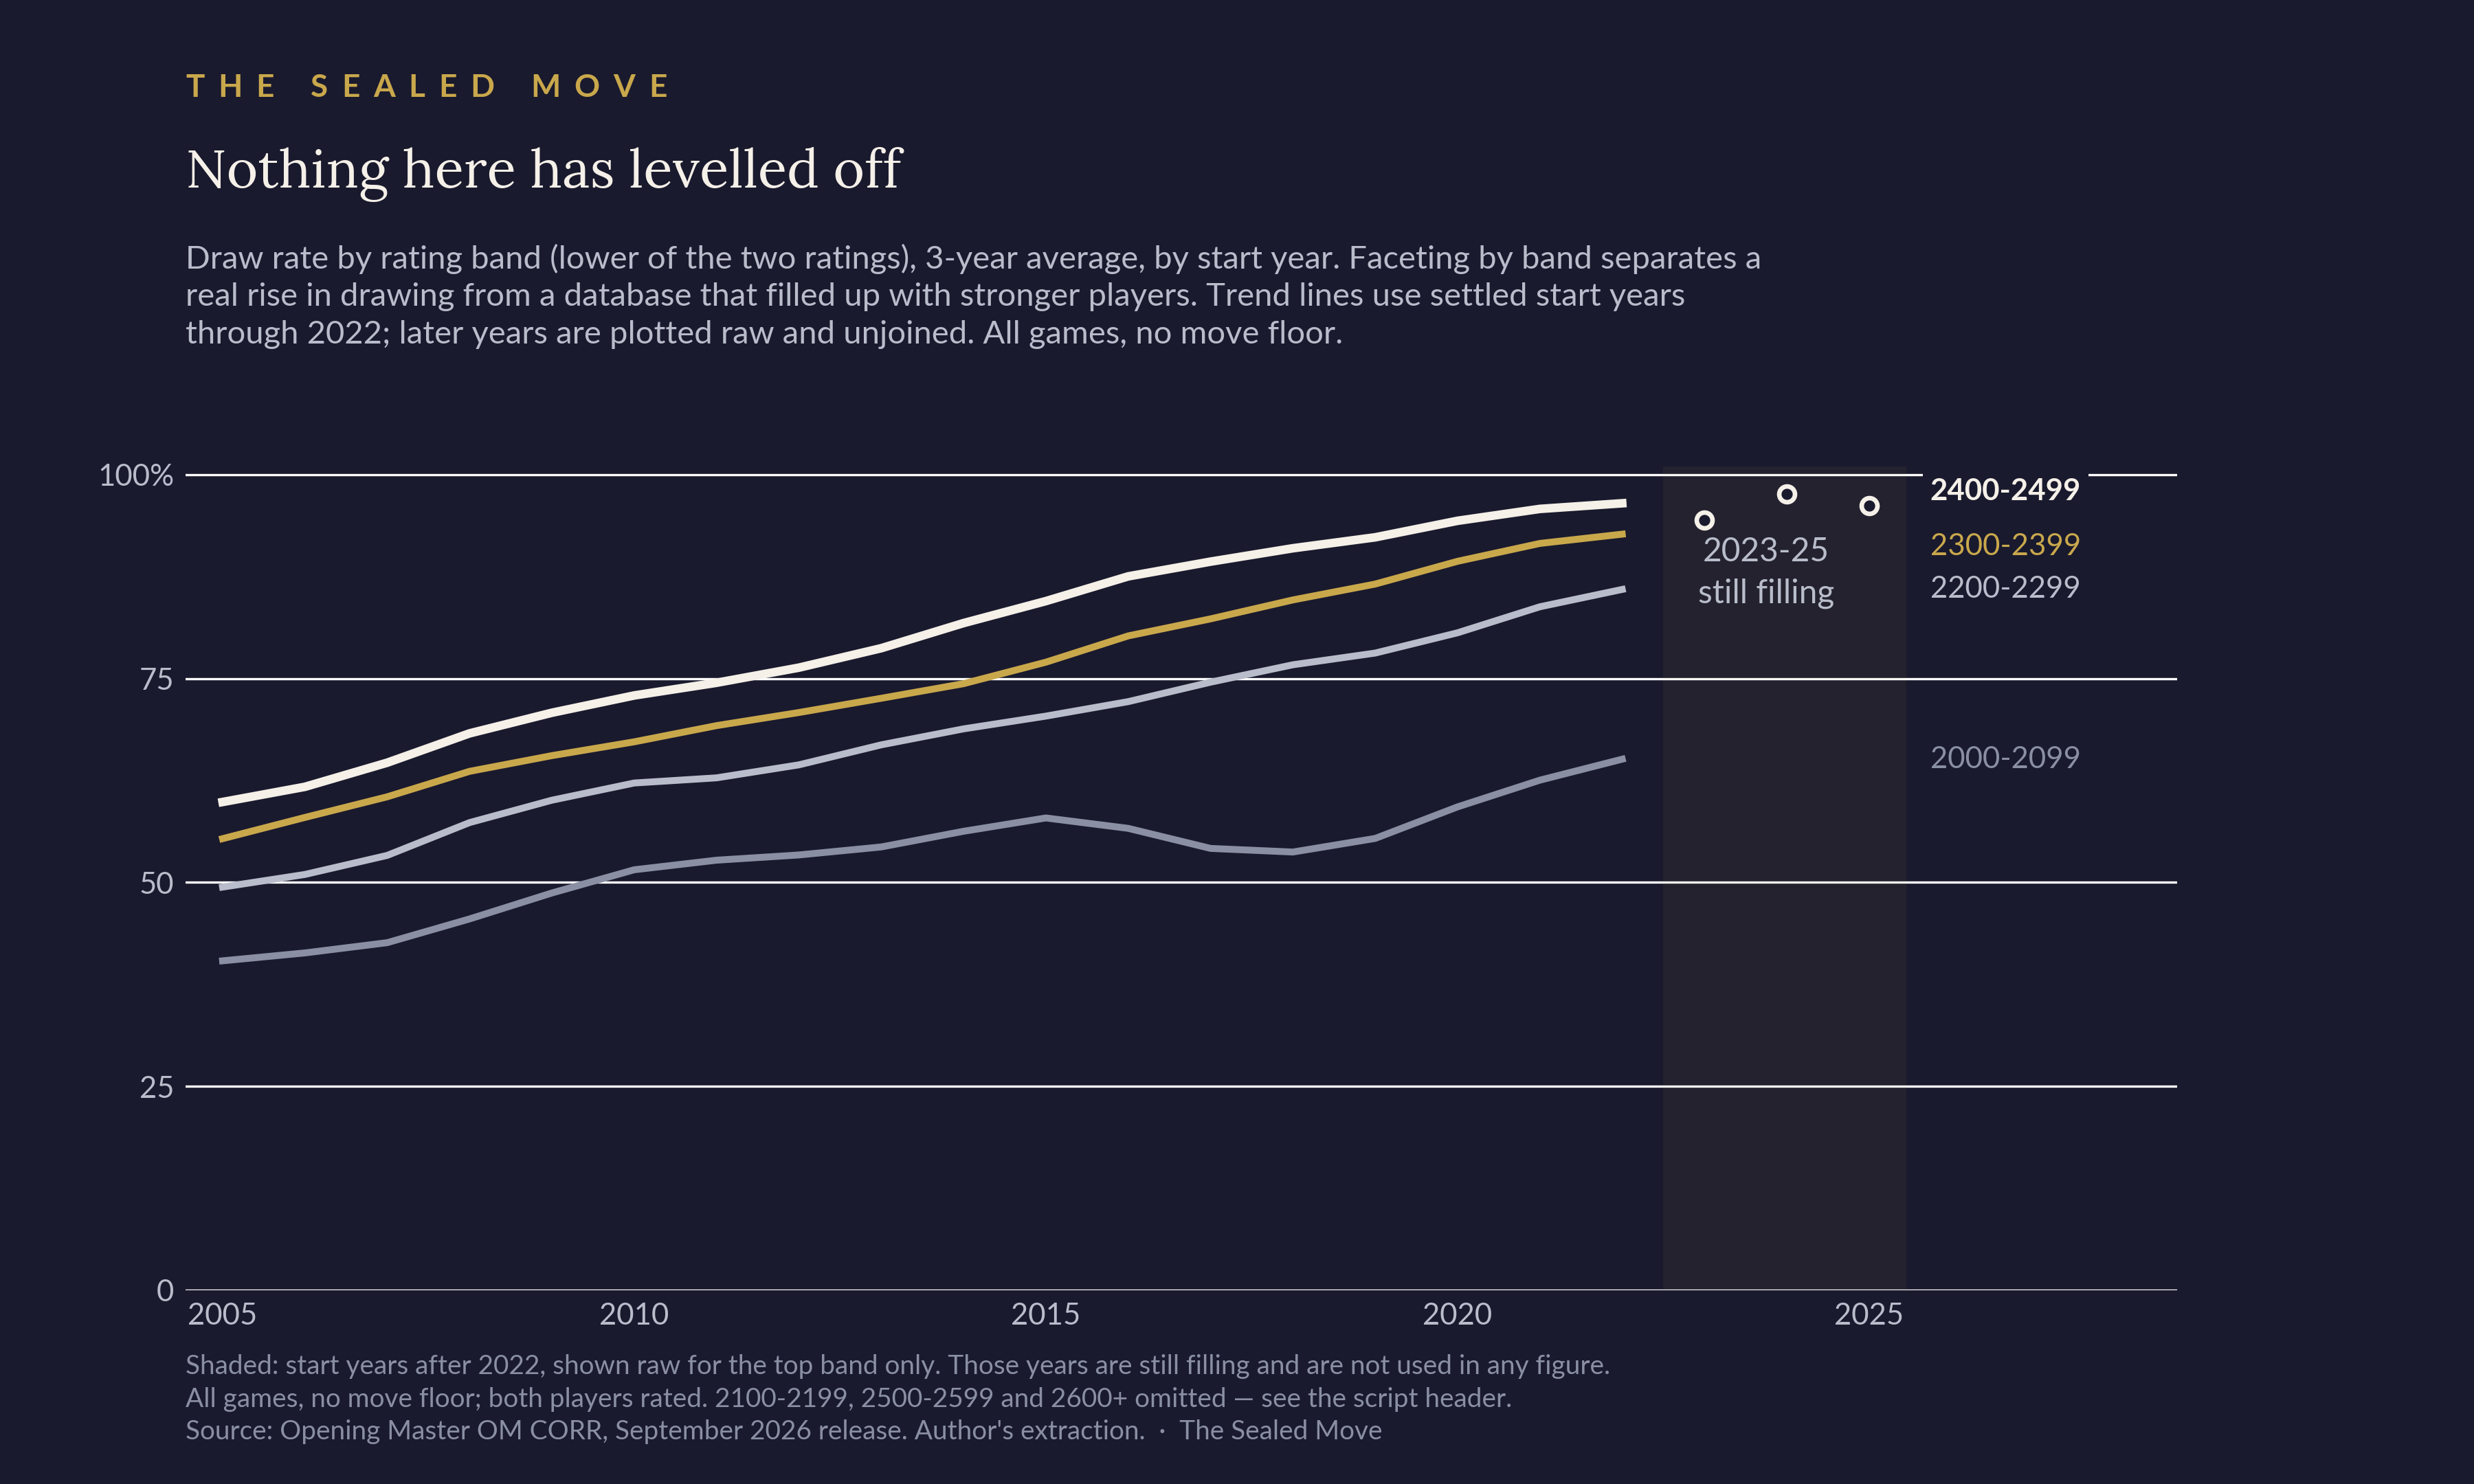
The right-hand side of that chart is what most readers will have seen in their own charts, so it needs explaining. The three years after 2022 are plotted as separate points and not joined to the line. At 2400-2499 they read 94.4%, 97.6% and 96.2%: they scatter over three points, and they will move again with the next release of the database, as more games from those start years finish. A chart that shows the rate levelling off after 2022 is drawing that line through years whose games have not all arrived; Section 5 sets out why.
On data that has settled, the draw rate has not yet reached a plateau, either over time or across ratings.
2. Splitting the decisive games
For every game that was not drawn, we asked whether the player who lost was lost on the board.
That question divides decisive games into two populations. In the first, a player was outplayed or blundered and the final position shows it. In the second the game ended for administrative reasons: a clock ran out, a player withdrew, an event was adjudicated, or someone stopped sending moves. We call the second kind administrative throughout. Operationally, the loser’s final position evaluates above −200 centipawns; the methods give the details.
Both are counted per thousand games played, not as shares of decisive games. Earlier versions of this argument, ours included, used shares, and that is why they kept describing a limit they could not locate. When both kinds are shares of the same total, a collapse in one shows up automatically as a rise in the other. Counted per thousand games played, each moves on its own, as Figure 2 shows.
At 2400 and above, across four periods:
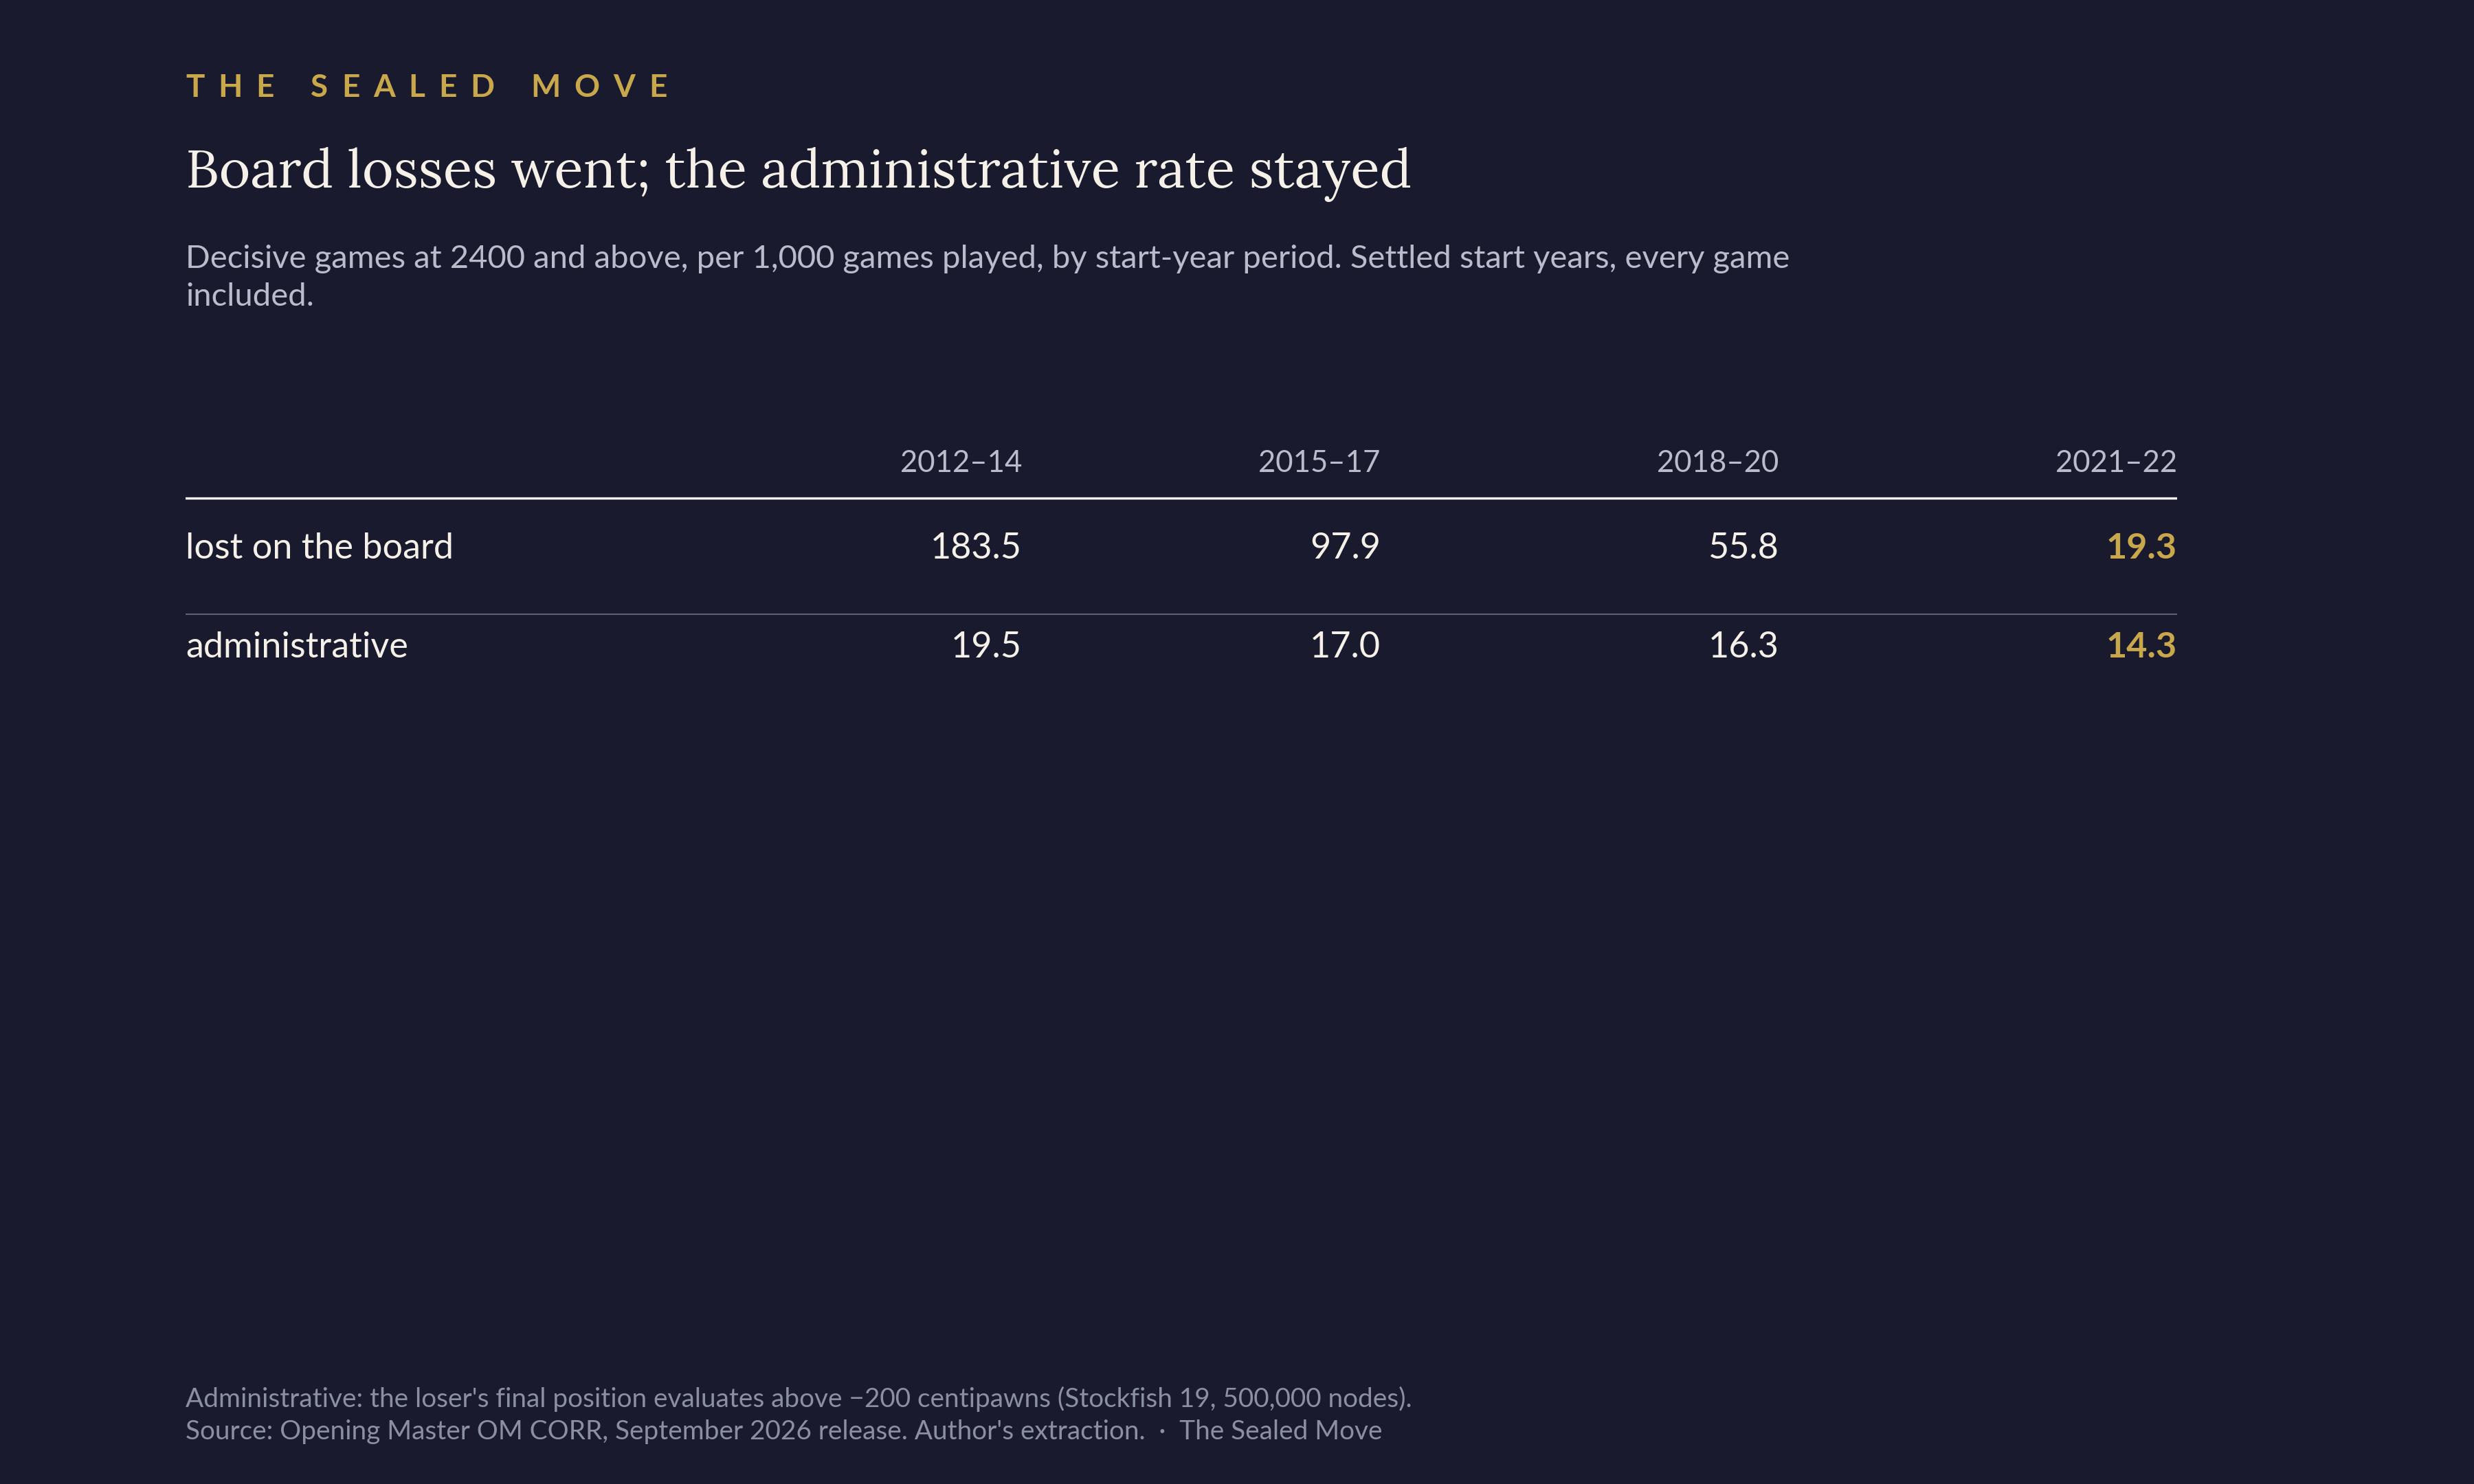
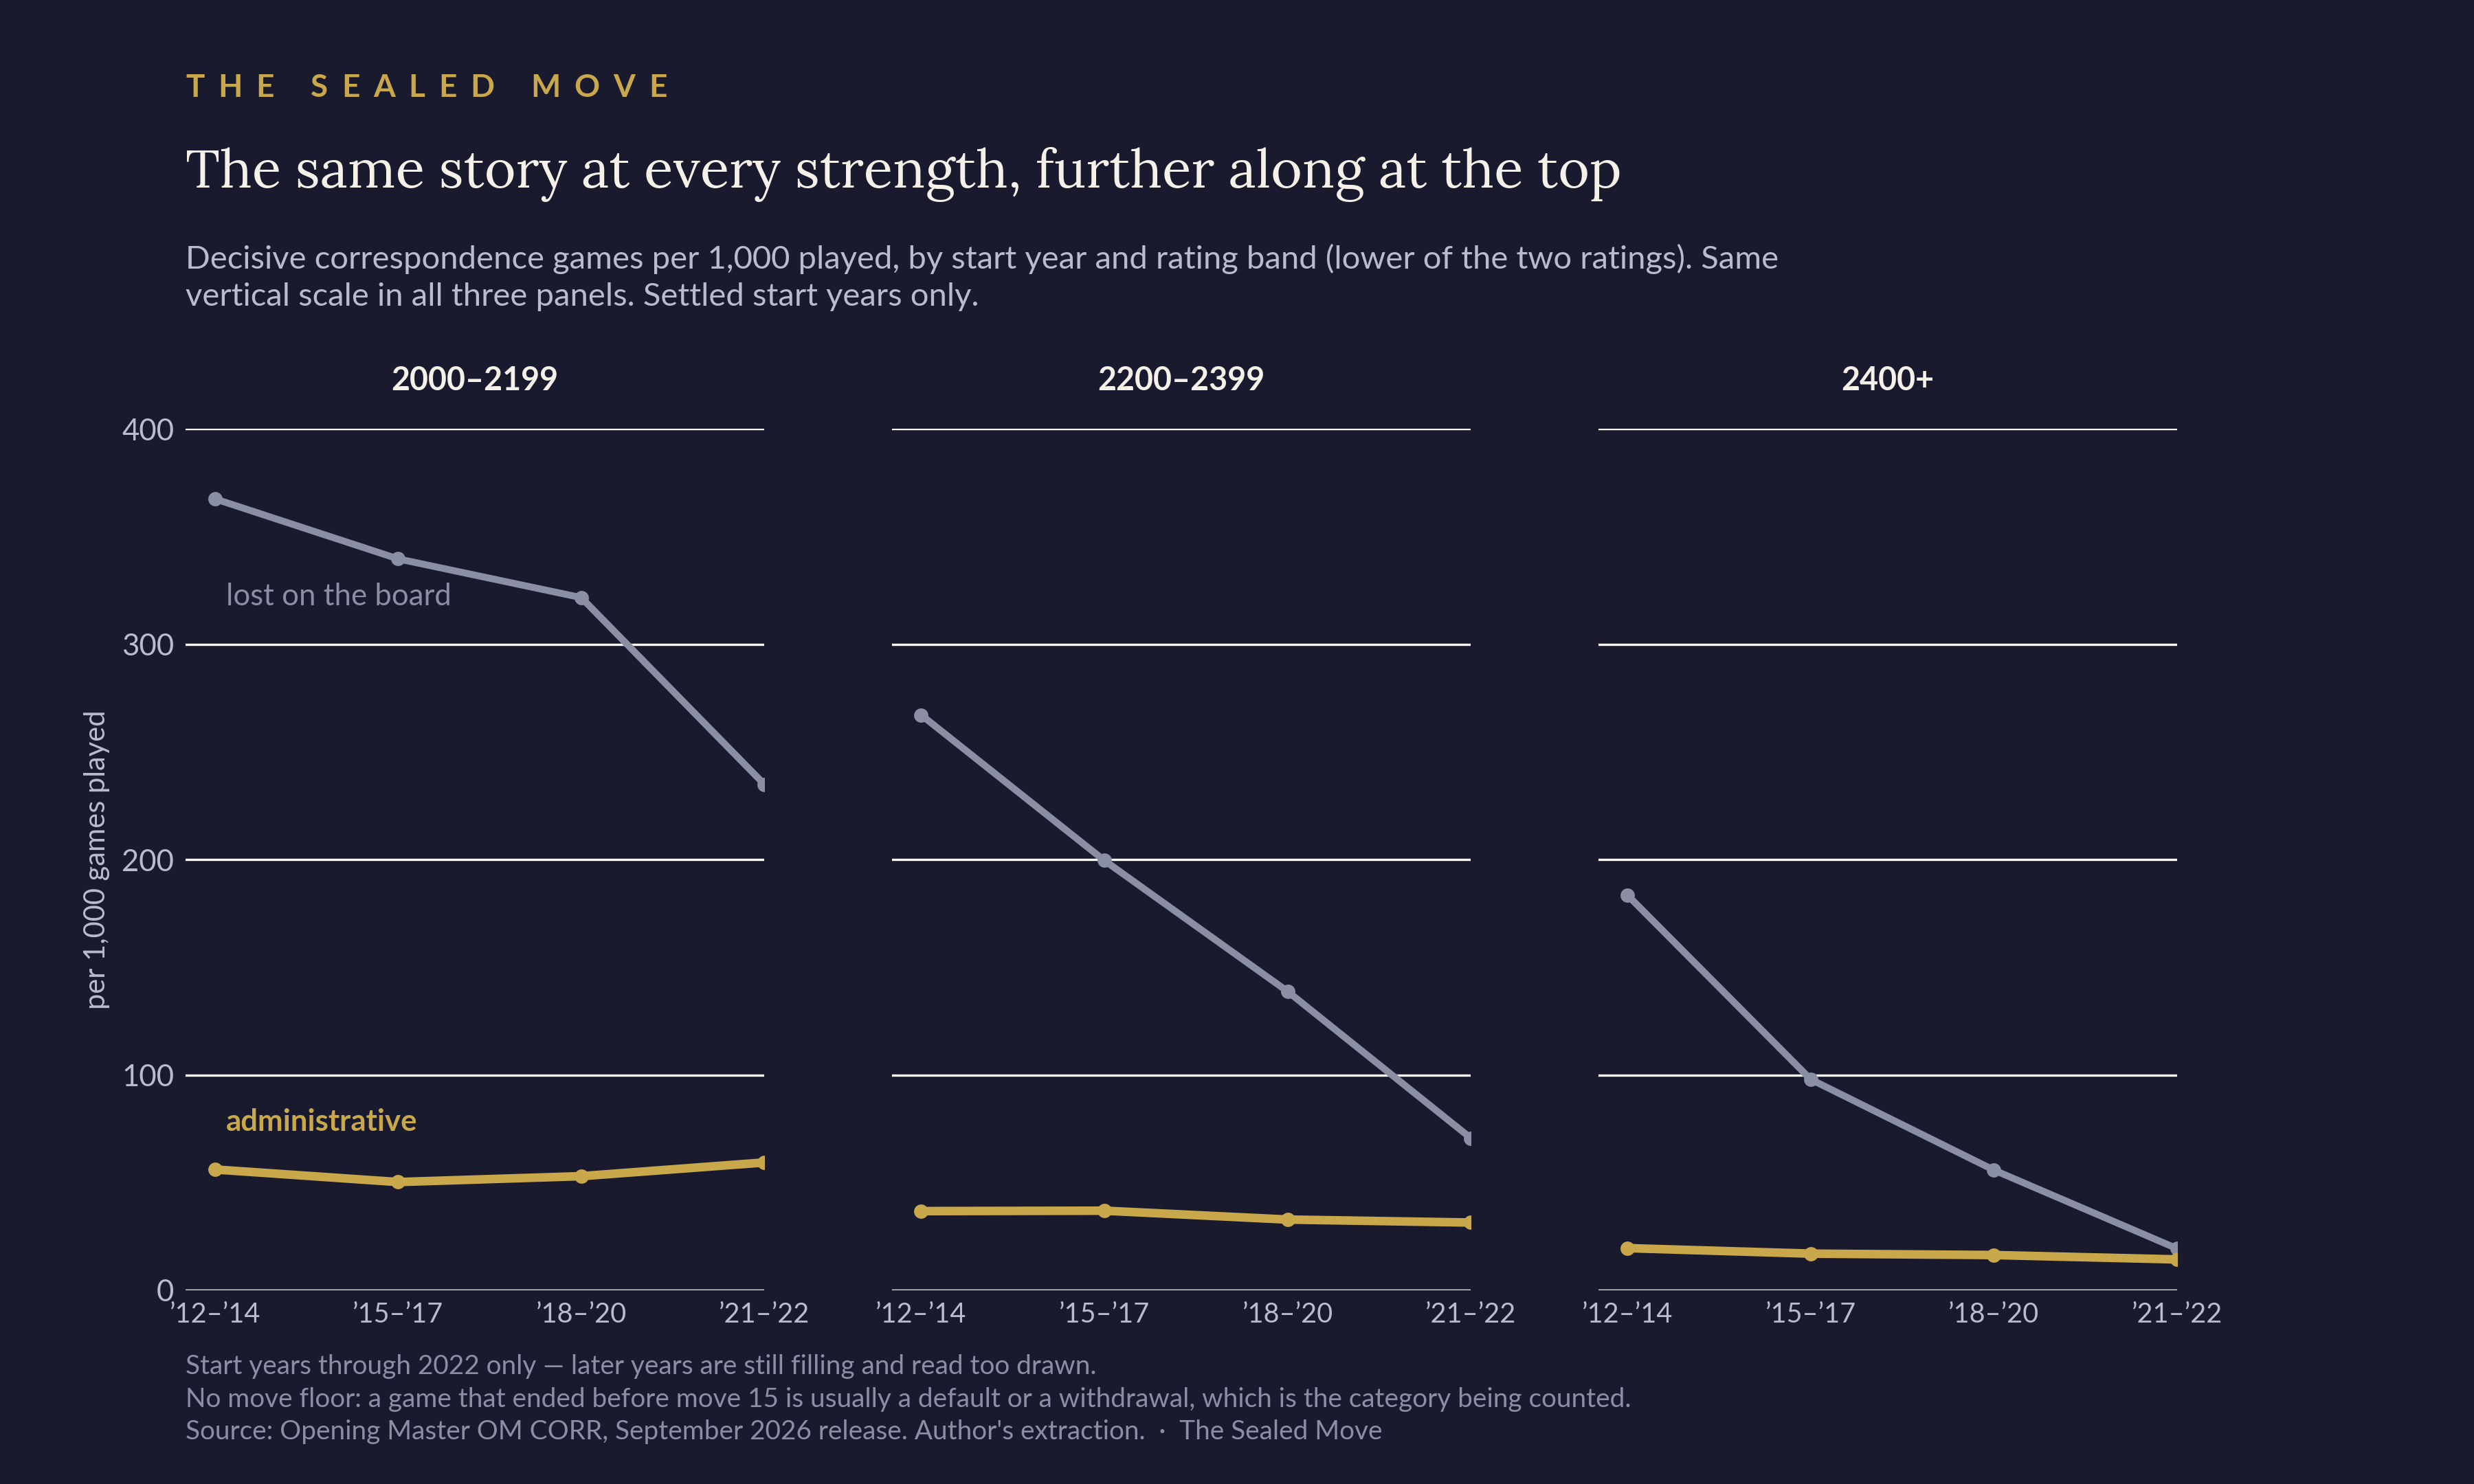
The board-loss component has nearly disappeared while the administrative component has held level, as Figures 3 and 4 show. Board losses fell 89.5% over the decade. Administrative terminations fell 27% as a point estimate, but a trend test cannot tell that apart from flat. Fitted annually on settled years 2012 to 2022, the administrative rate changes by −0.56 per thousand per year at 2400+ [−1.24, +0.12], p=0.14; by −0.74 at 2200-2399 [−1.65, +0.17], p=0.15; and by +0.15 at 2000-2199 [−1.05, +1.35], p=0.81. None of the three is significant and their signs disagree. Over the same window the board-loss rate falls by between 12 and 23 per thousand per year, every band at p<0.001.
The move filter was removing the evidence
Earlier versions of this analysis excluded games shorter than fifteen moves. That is a standard hygiene filter, and here it does harm. At these ratings a game that ends before move fifteen is usually a default, a withdrawal or a game that never properly started, which is the administrative category being counted. With the filter, the administrative rate at 2400+ declines by −0.76 per thousand per year, p=0.005, and the piece would have described a slowly eroding floor. Without it the slope is −0.56, p=0.14, and the floor is level.
The damage grew over the decade because the excluded category grew. Short games were 1.03% of decisive games at 2400+ in 2012 and 20.39% in 2022.
From here on every game-level figure includes all games regardless of length. Figures measured on the moves themselves, which means accuracy and the anatomy in Section 6, still need a fifteen-move floor, as the methods note.
3. Can a fixed-node engine make this call?
The natural objection is that a fixed-node search cannot judge a position two correspondence players analysed for months. That is true, and the measurement does not depend on it.
What the measurement does is compare two groups of positions scored by the same engine at the same settings. Across bands 2200 and up, the loser’s final position evaluates above −200 centipawns in 13.1% of decisive games [12.9, 13.2], out of 162,779. In a control of drawn games matched on band and year, the figure is 99.4% [99.3, 99.4], out of 151,039. For an error in the engine’s absolute judgement to matter, it would have to close a gap of eighty-six points between those groups.
Search depth makes little difference. On a 5,000-game subsample the decisive figure is 11.9% at 500k nodes [11.1, 12.8] and 10.1% at 10 million [9.3, 10.9]. Twenty times the search moves it by 1.8 points, in the direction that lowers the administrative floor, and the drawn control stays at 99.3%.
A third check uses information the engine never sees. A small share of games in the corpus carry a termination tag, and scoring them by tag lines up with the split, as Figure 5 shows.
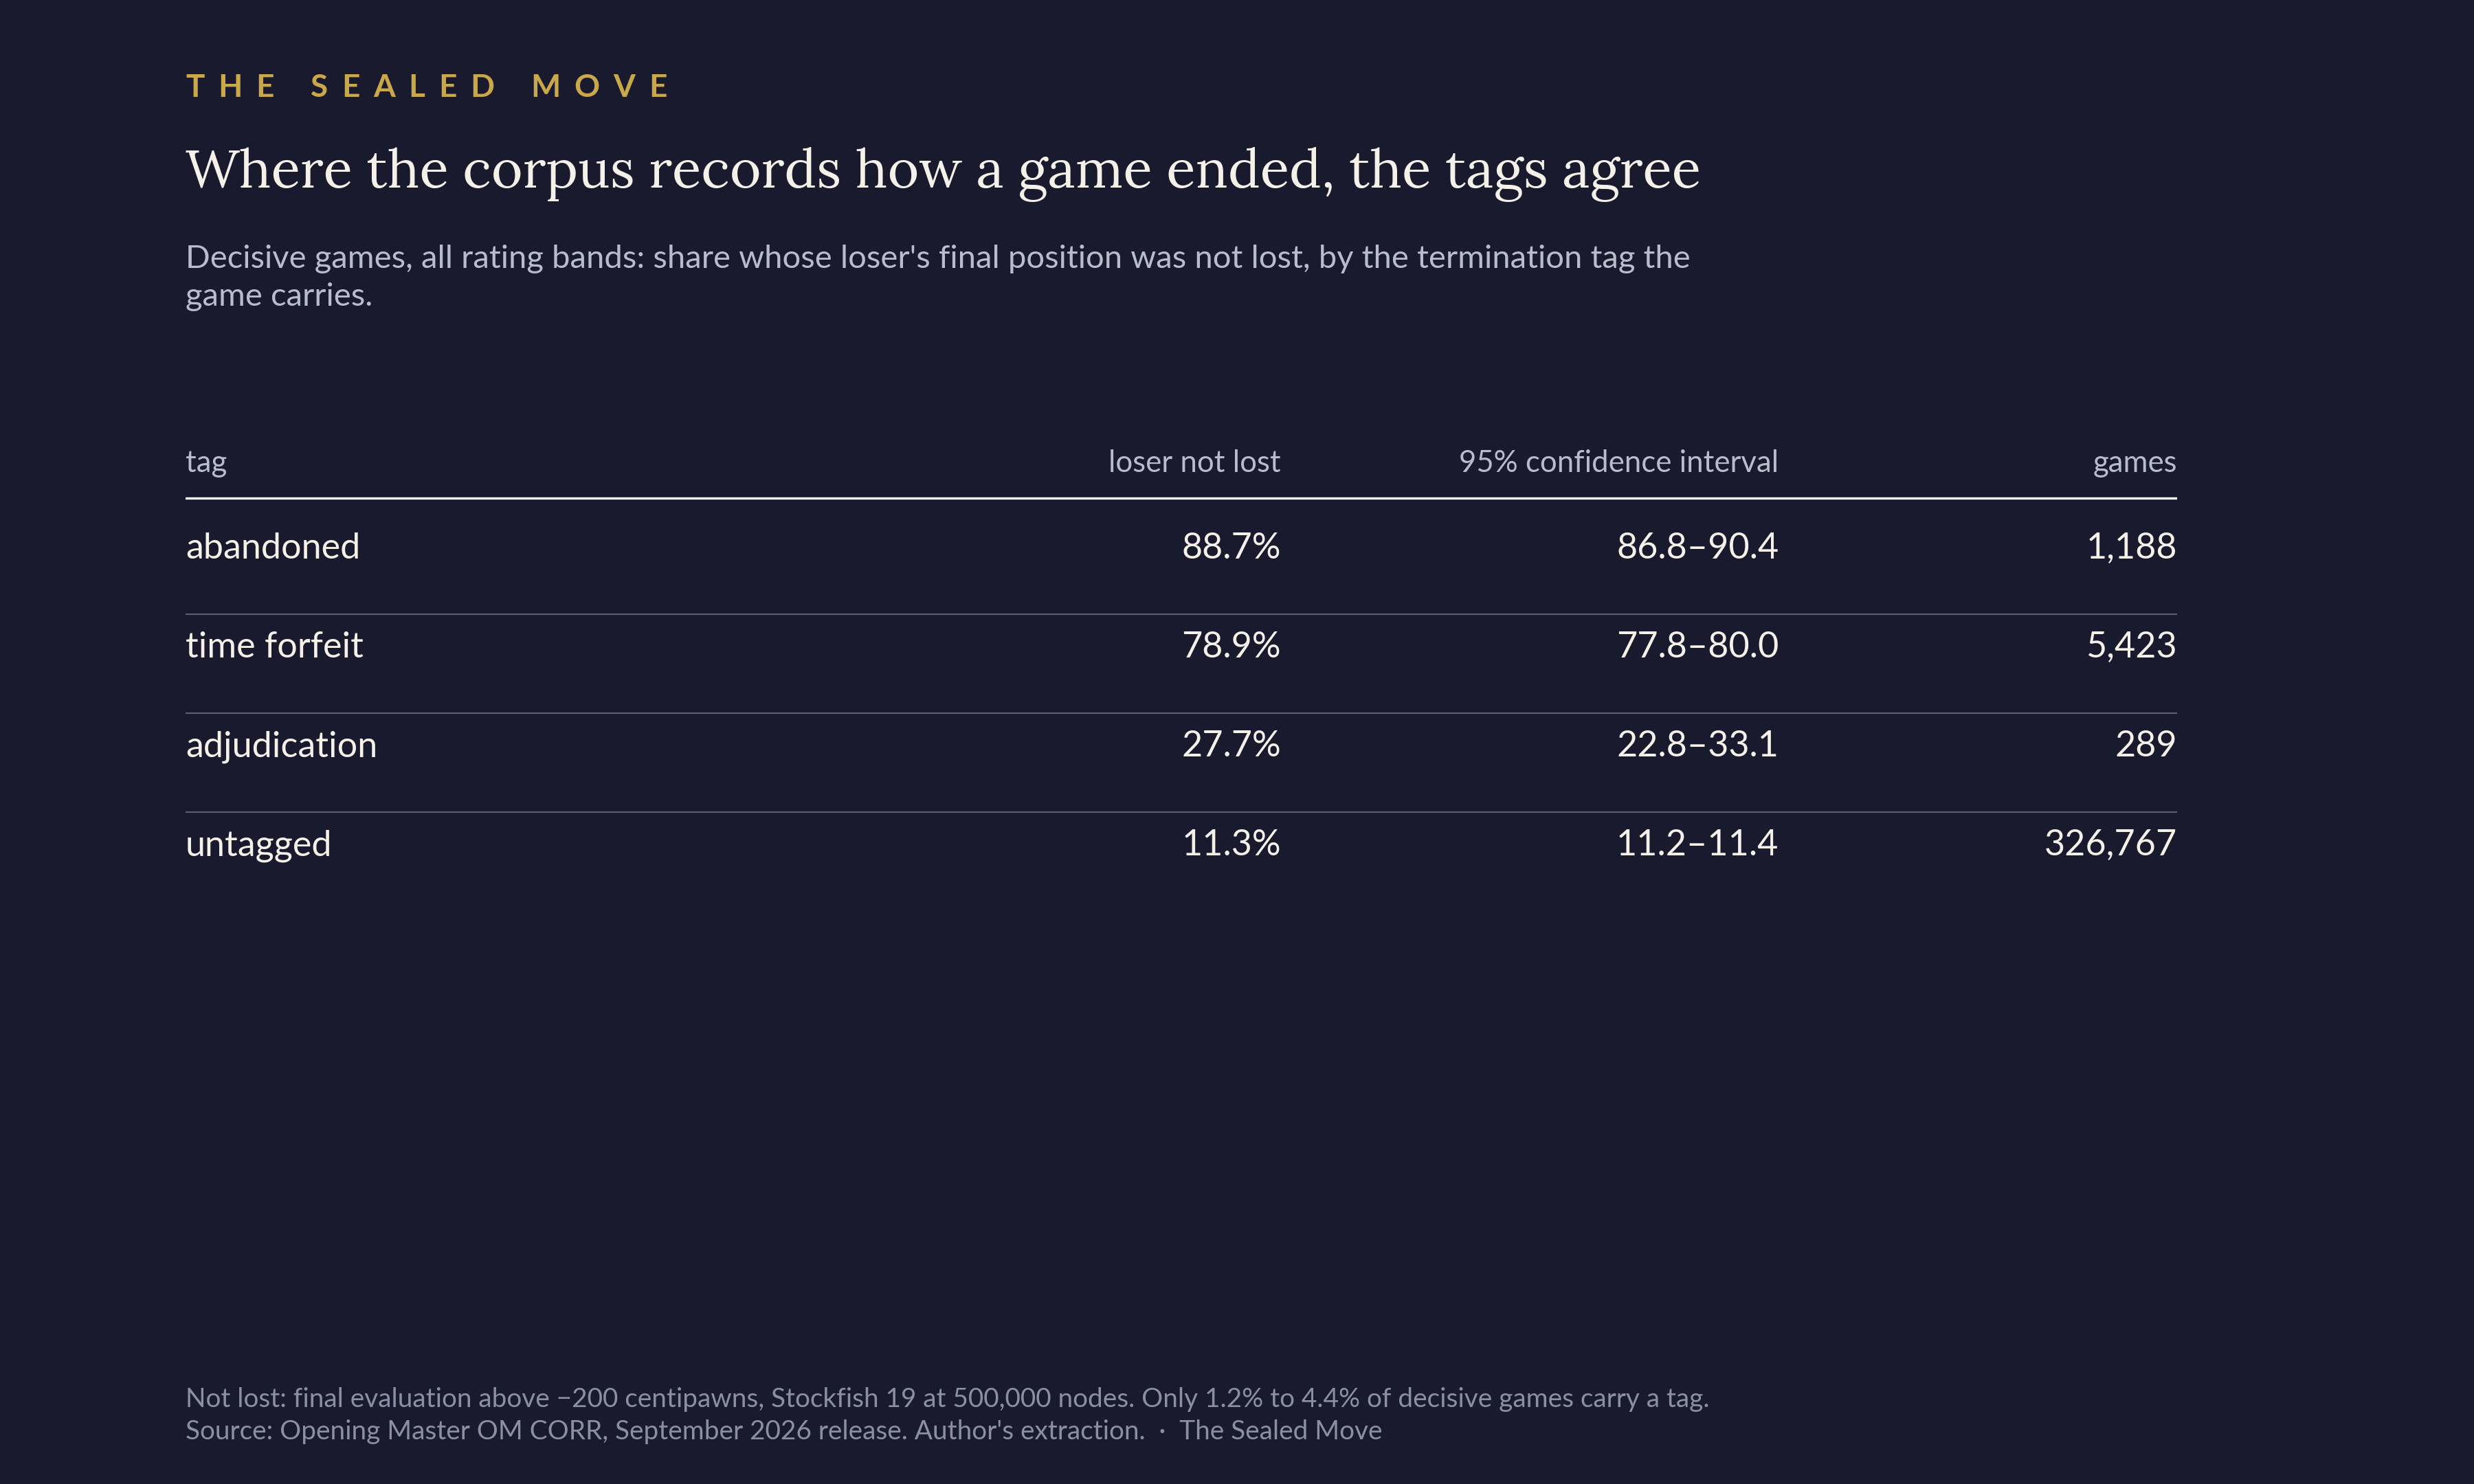
Games that ended on the clock or were abandoned mostly ended in positions that were not lost, while adjudications mostly ended in lost ones, which is what adjudication is for. Only between 1.2% and 4.4% of decisive games carry a tag, and the rate varies by band, so the tags cannot support a measurement of their own. They confirm that the engine split is separating the categories as intended.
4. The floor, the ceiling, and what kind of claim this is
If the administrative rate is not falling, it is a floor, and a floor can be measured directly. The administrative floor sets a limit on the draw rate, the rate that would be reached if every other game were drawn, whether or not the data has yet reached a plateau. Previous commentary on where correspondence chess is heading, ours included, has fitted curves to the draw rate and asked when they bend. Instead, the quantity underneath the draw rate can be measured, and the ceiling read off it.
Figure 6 shows settled years 2016 to 2022, every game included, per thousand games played.
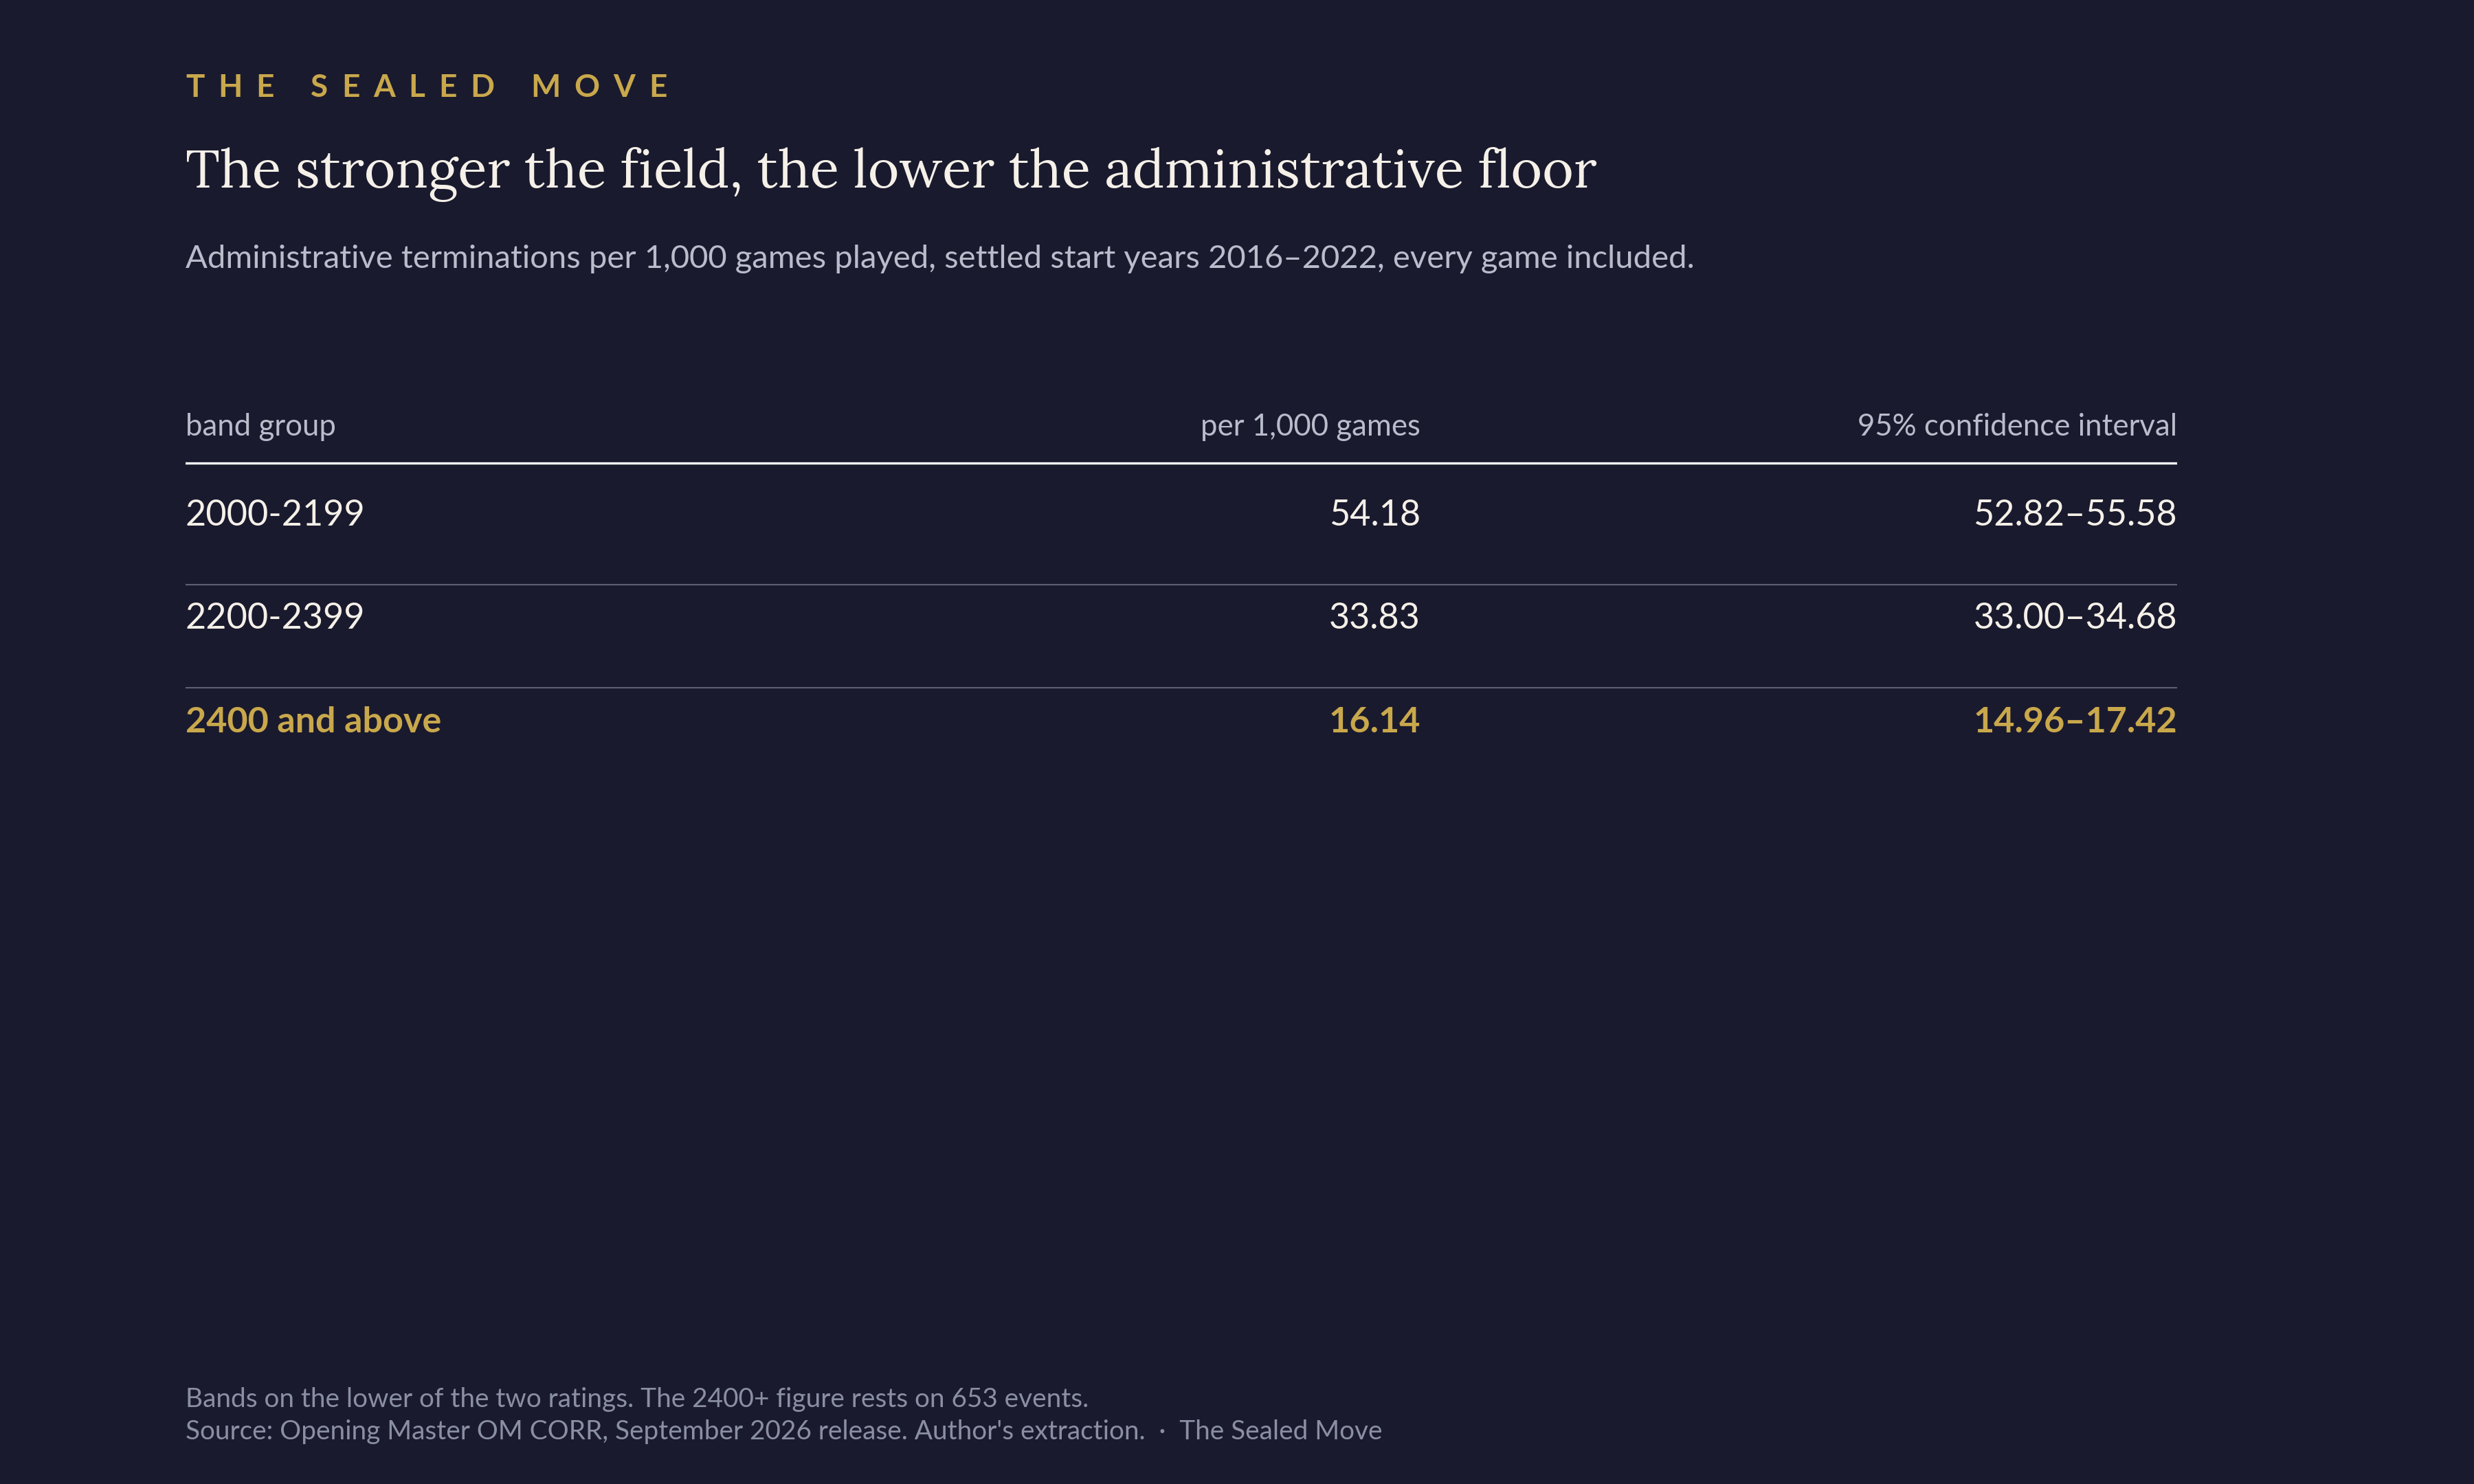
The 2400+ figure rests on 653 events. The floor falls by more than a factor of three from the bottom group to the top, so stronger players also withdraw, forfeit and default less often. This data cannot say whether that comes from temperament, from experience of what a three-year game costs, or from playing in events that hold people to their commitments.
From a floor to a ceiling
A draw rate cannot exceed one minus the rate at which games end for reasons other than play. The floor above is measured as not lost, the loser’s final position above −200 centipawns, and that slightly undercounts administrative terminations, since a player who is losing is more likely to be the one who stops. The tag data in Section 3 gives the size of the gap: 78.9% of time forfeits happen in positions that were not lost, so about a fifth happen in positions that were.
Call that capture rate f. Then:
ceiling = 1 − (not-lost per game) ÷ f
At 2400 and above, with f = 0.80: 16.14 per thousand is 1.614%, divided by 0.80 is 2.018%, so the ceiling is 97.98%.
The choice of f barely matters. Across the whole plausible range, from f = 1.0 (every administrative termination leaves the loser not lost) down to 0.7, the ceiling moves between 98.39% and 97.69%, so the published figure is 97.7% to 98.4%. And because not-lost is a lower bound on administrative terminations, this ceiling is an upper bound; the true headroom may be slightly smaller.
How much headroom is left
An earlier version of this piece compared a 98% ceiling with an observed 94% and found four points of headroom. Those figures came from different populations. The 94% was one band over one window and the ceiling a band group over another, and averaging seven years of a rising series pulls the observed rate below where the game is now.
Like for like, at 2400 and above on settled 2021–22 data, the observed draw rate is 96.64% [96.30, 96.98] on 10,984 games. Against a ceiling of 97.7% to 98.4% that leaves between about one and two points of headroom. The top of correspondence chess is close to its frictional limit, though it has not reached it.
Is this forty players?
A floor built on 653 administrative events might describe a few players who time out repeatedly rather than the whole population. In that case it would be measuring a habit of particular people and calling it a rate would mislead.
The 653 terminations at 2400 and above between 2016 and 2022 are spread across 254 distinct players, out of 1,250 players who appear in the band. On its own that does not settle the question, because some players play far more games than others. The real test is whether administrative losses cluster on individuals more than those players’ overall loss frequency would predict.
Against a null that holds each player’s total loss frequency fixed and reshuffles which of their losses were administrative, administrative events are more concentrated than chance in all fifteen band-group and window combinations, on each of three statistics (Gini, Herfindahl and top-ten share), every one at p < 0.0001 on ten thousand permutations. Board losses tested the same way are significant in only three to six of the fifteen cells, and in several they come out less concentrated than chance. A statistic that simply rewarded rare events would have produced the same result for both.
A more serious confound is the tournament. One badly run event with a dozen withdrawals would show up as player concentration in that test. Permuting the labels within each event, instead of across the whole band, controls for it, and the effect shrinks considerably. Over 2016–2022 at 2400 and above, administrative concentration is 2.3 times chance against the player null but 1.30 against the event null, with board losses at 1.03. Some asymmetry remains, but most of the apparent player concentration at the top comes from event composition.
In 2021–22 it is smaller again, 1.16 against 1.05, and identical on the Gini measure. The test also has little to work with in that window, since only 33 of the 155 administrative events share a tournament with another one, so the event confound cannot be ruled out there.
Administrative terminations therefore cluster mainly by event rather than by individual. That fits the idea of a frictional floor: it reflects how tournaments are run more than who is playing in them.
Persistence needs the same care. Among players with an administrative loss at 2400 and above between 2016 and 2022, those who had an earlier one are 2.02 times as likely to be in that group as the base rate predicts. That figure must be compared with 1.42, the ratio produced when labels are shuffled within events. Events repeat their participants, so composition alone creates some apparent persistence. When measured against 1.42, the excess is large, p below 0.0005.
For 2021–22 alone the excess disappears. The observed ratio is about the same, 1.98, but the composition benchmark rises to 1.85 and the difference is not significant. The test has more room than the concentration test had, with 231 of 730 events in that window open to permutation against 33 of 155, though that falls short of a formal power calculation. In the last two settled years there is no detectable player-level persistence at the top.
Three in five of the players with an administrative loss in 2021–22 had never had one before, and about three-quarters over 2016–2022. Event composition predicts most of that as well, so it describes who these players are without adding evidence either way.
Players are identified by normalised name, and that cuts both ways. A bare surname can merge two players and overstate concentration, while inconsistent spellings split one player into two and understate it; which effect dominates is unknown.
What kind of claim this is
Economists will think of the natural rate of unemployment, but the NAIRU is defined by a trade-off: push unemployment below it and inflation accelerates. Nothing comparable happens here. No other quantity gets worse as the draw rate rises, so the full analogy does not carry over.
The narrower analogy is with frictional unemployment, the churn a process generates because it involves administration, independent of how well anyone plays. That reading needs the frictional component to be flat, the component above it to have collapsed, and the floor to sit clearly above zero. Section 2 shows the first two: no band group has an administrative trend distinguishable from zero, and board losses at the top fell 89.5% over the decade. The floor of 16.14 per thousand has an interval nowhere near zero. If any of these failed, we would drop the frame.
What this replaces
An earlier piece in this publication said that more years of data were needed before the ceiling could be identified. That was wrong. More years of draw rates will not reveal a ceiling, because the draw rate approaches its bound gradually and a curve fitted to it can be made to bend wherever you like. The friction under it is observable now, it is level, and it puts the bound at 97.7% to 98.4%.
5. Why the analysis stops at 2022
Readers of this publication have the same database, or one very like it, and can rerun most of this. They will get different numbers for two reasons, and the same two reasons are why this analysis stops at 2022.
Recent years are still arriving
The corpus dates a game by when it started and records no completion date, so a “2022 game” began in 2022 and may have finished in 2025. At correspondence time controls that lag is normal. A recent start year therefore holds only part of its eventual games, and the part that has arrived is not a random sample.
Six consecutive releases of the database, from September 2024 to September 2026, make it possible to track a fixed start year as later releases add games to it. Figure 7 summarises this at 2400-2499.
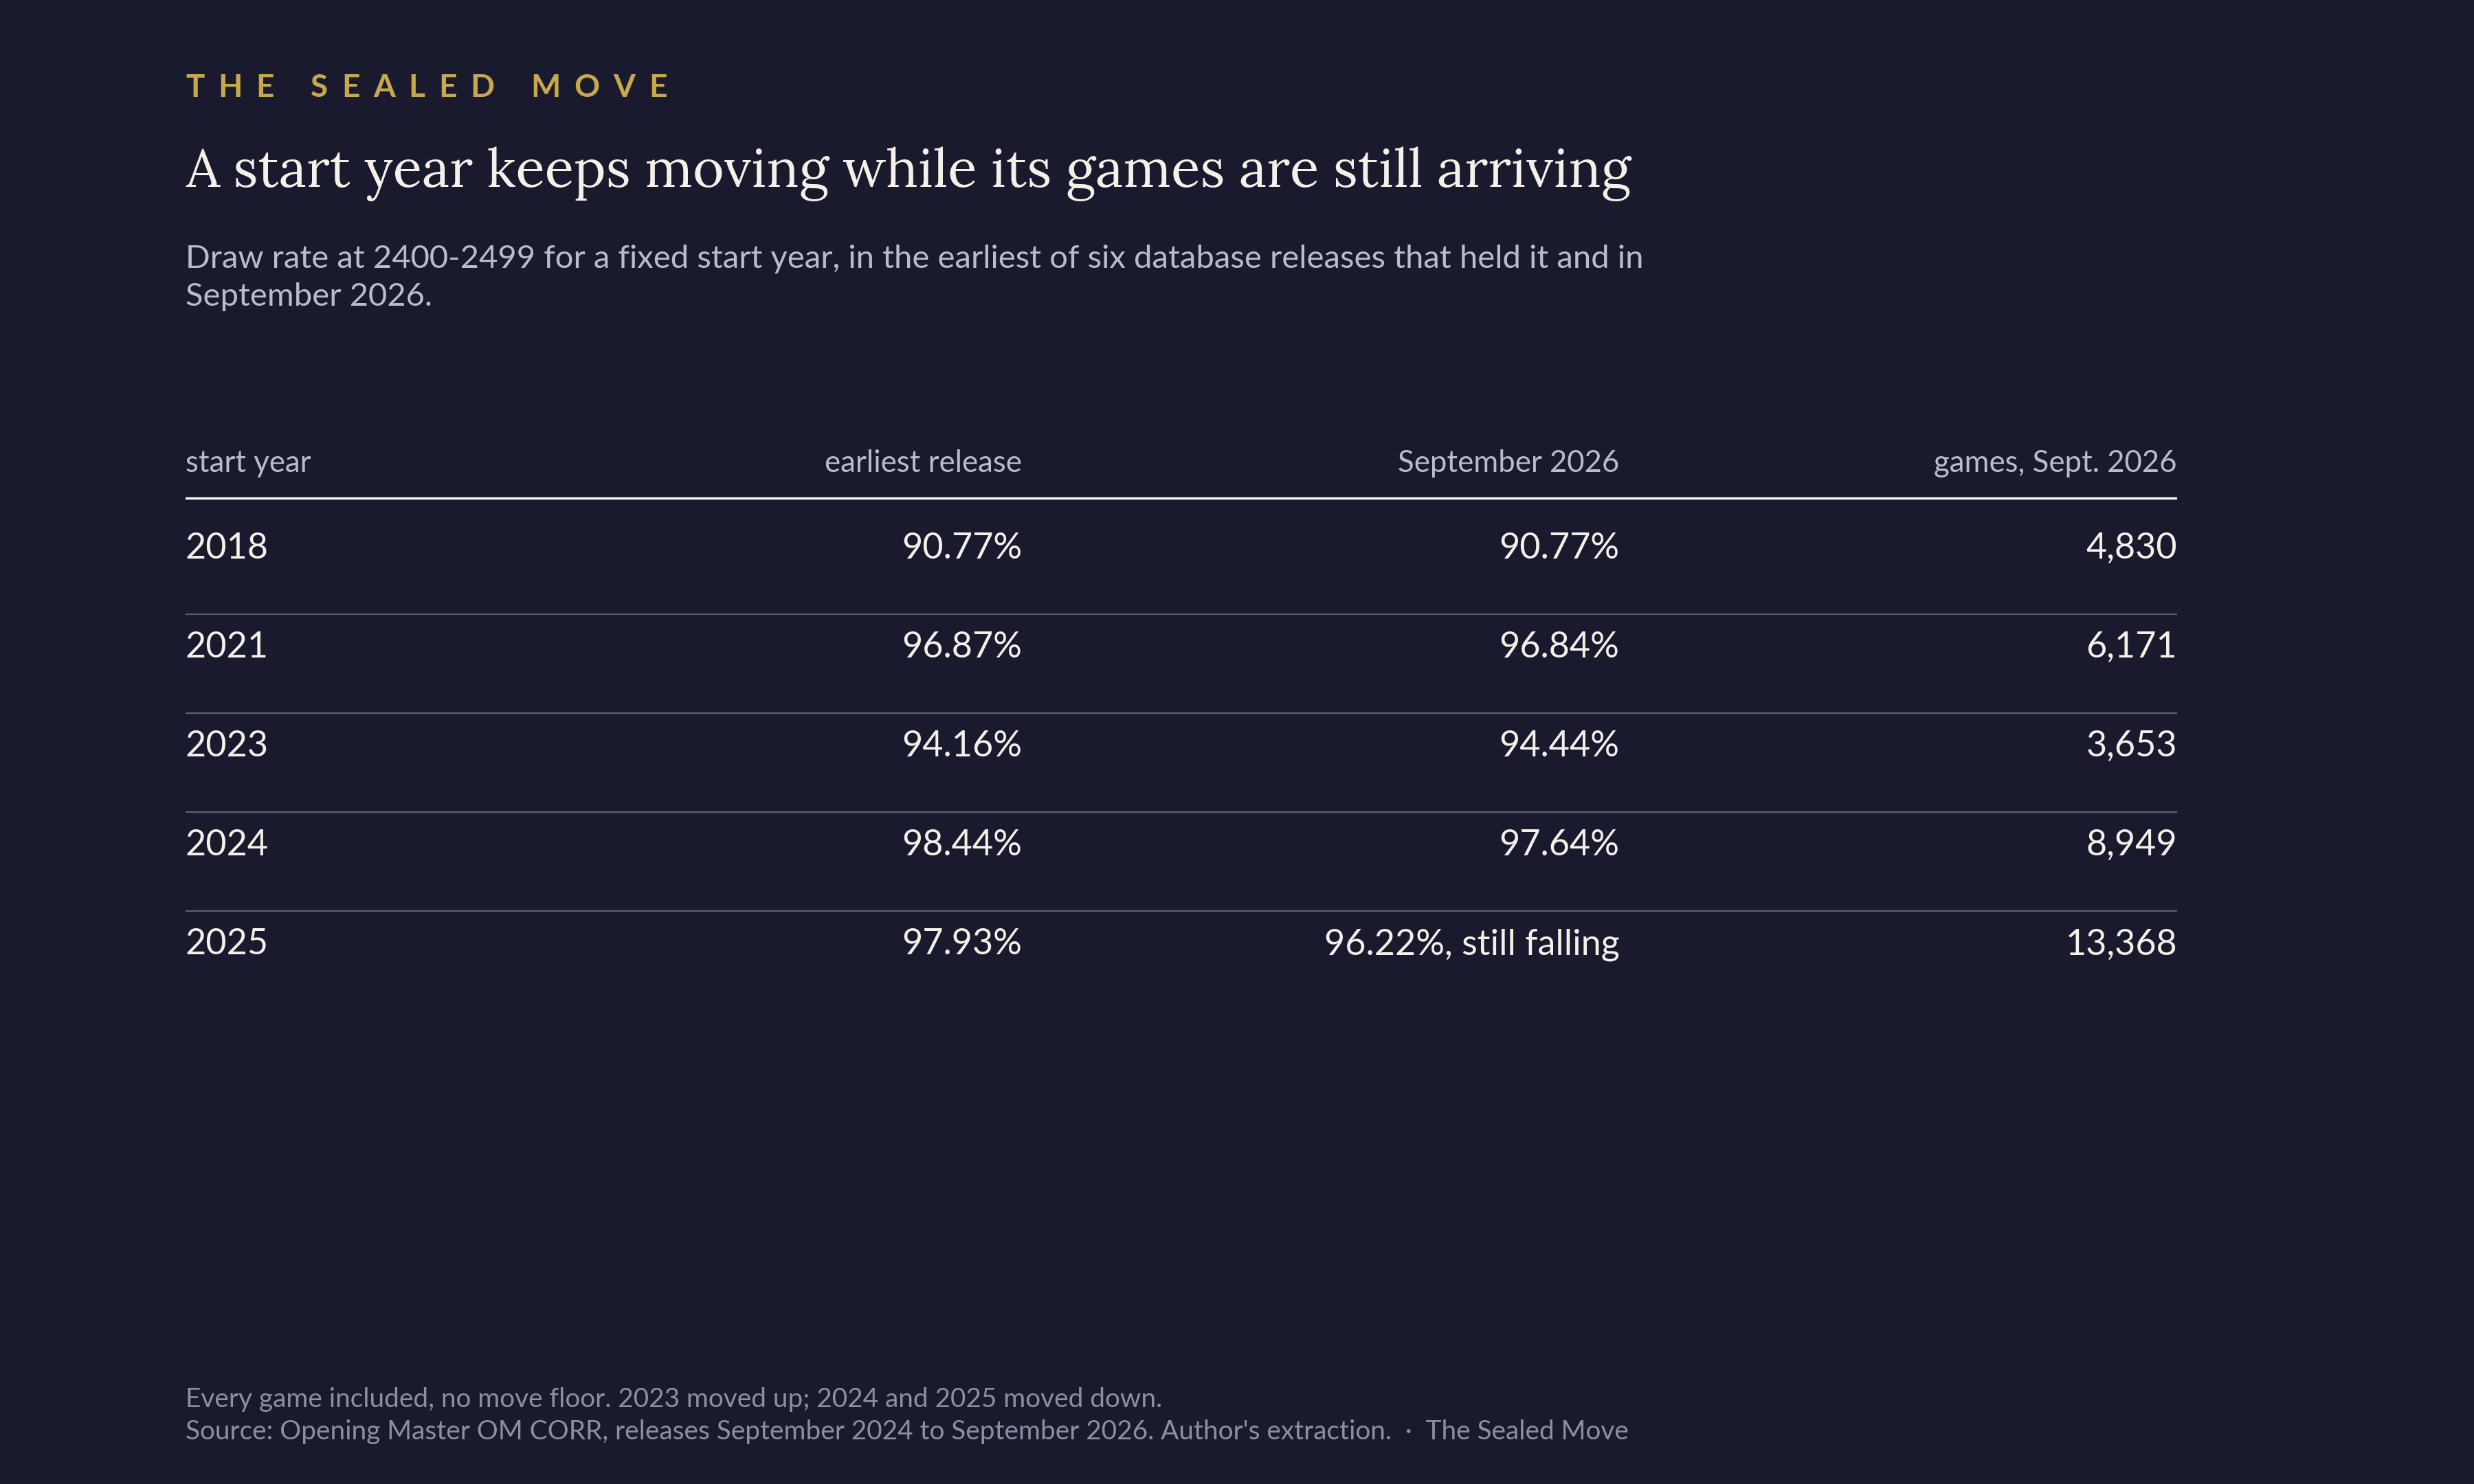
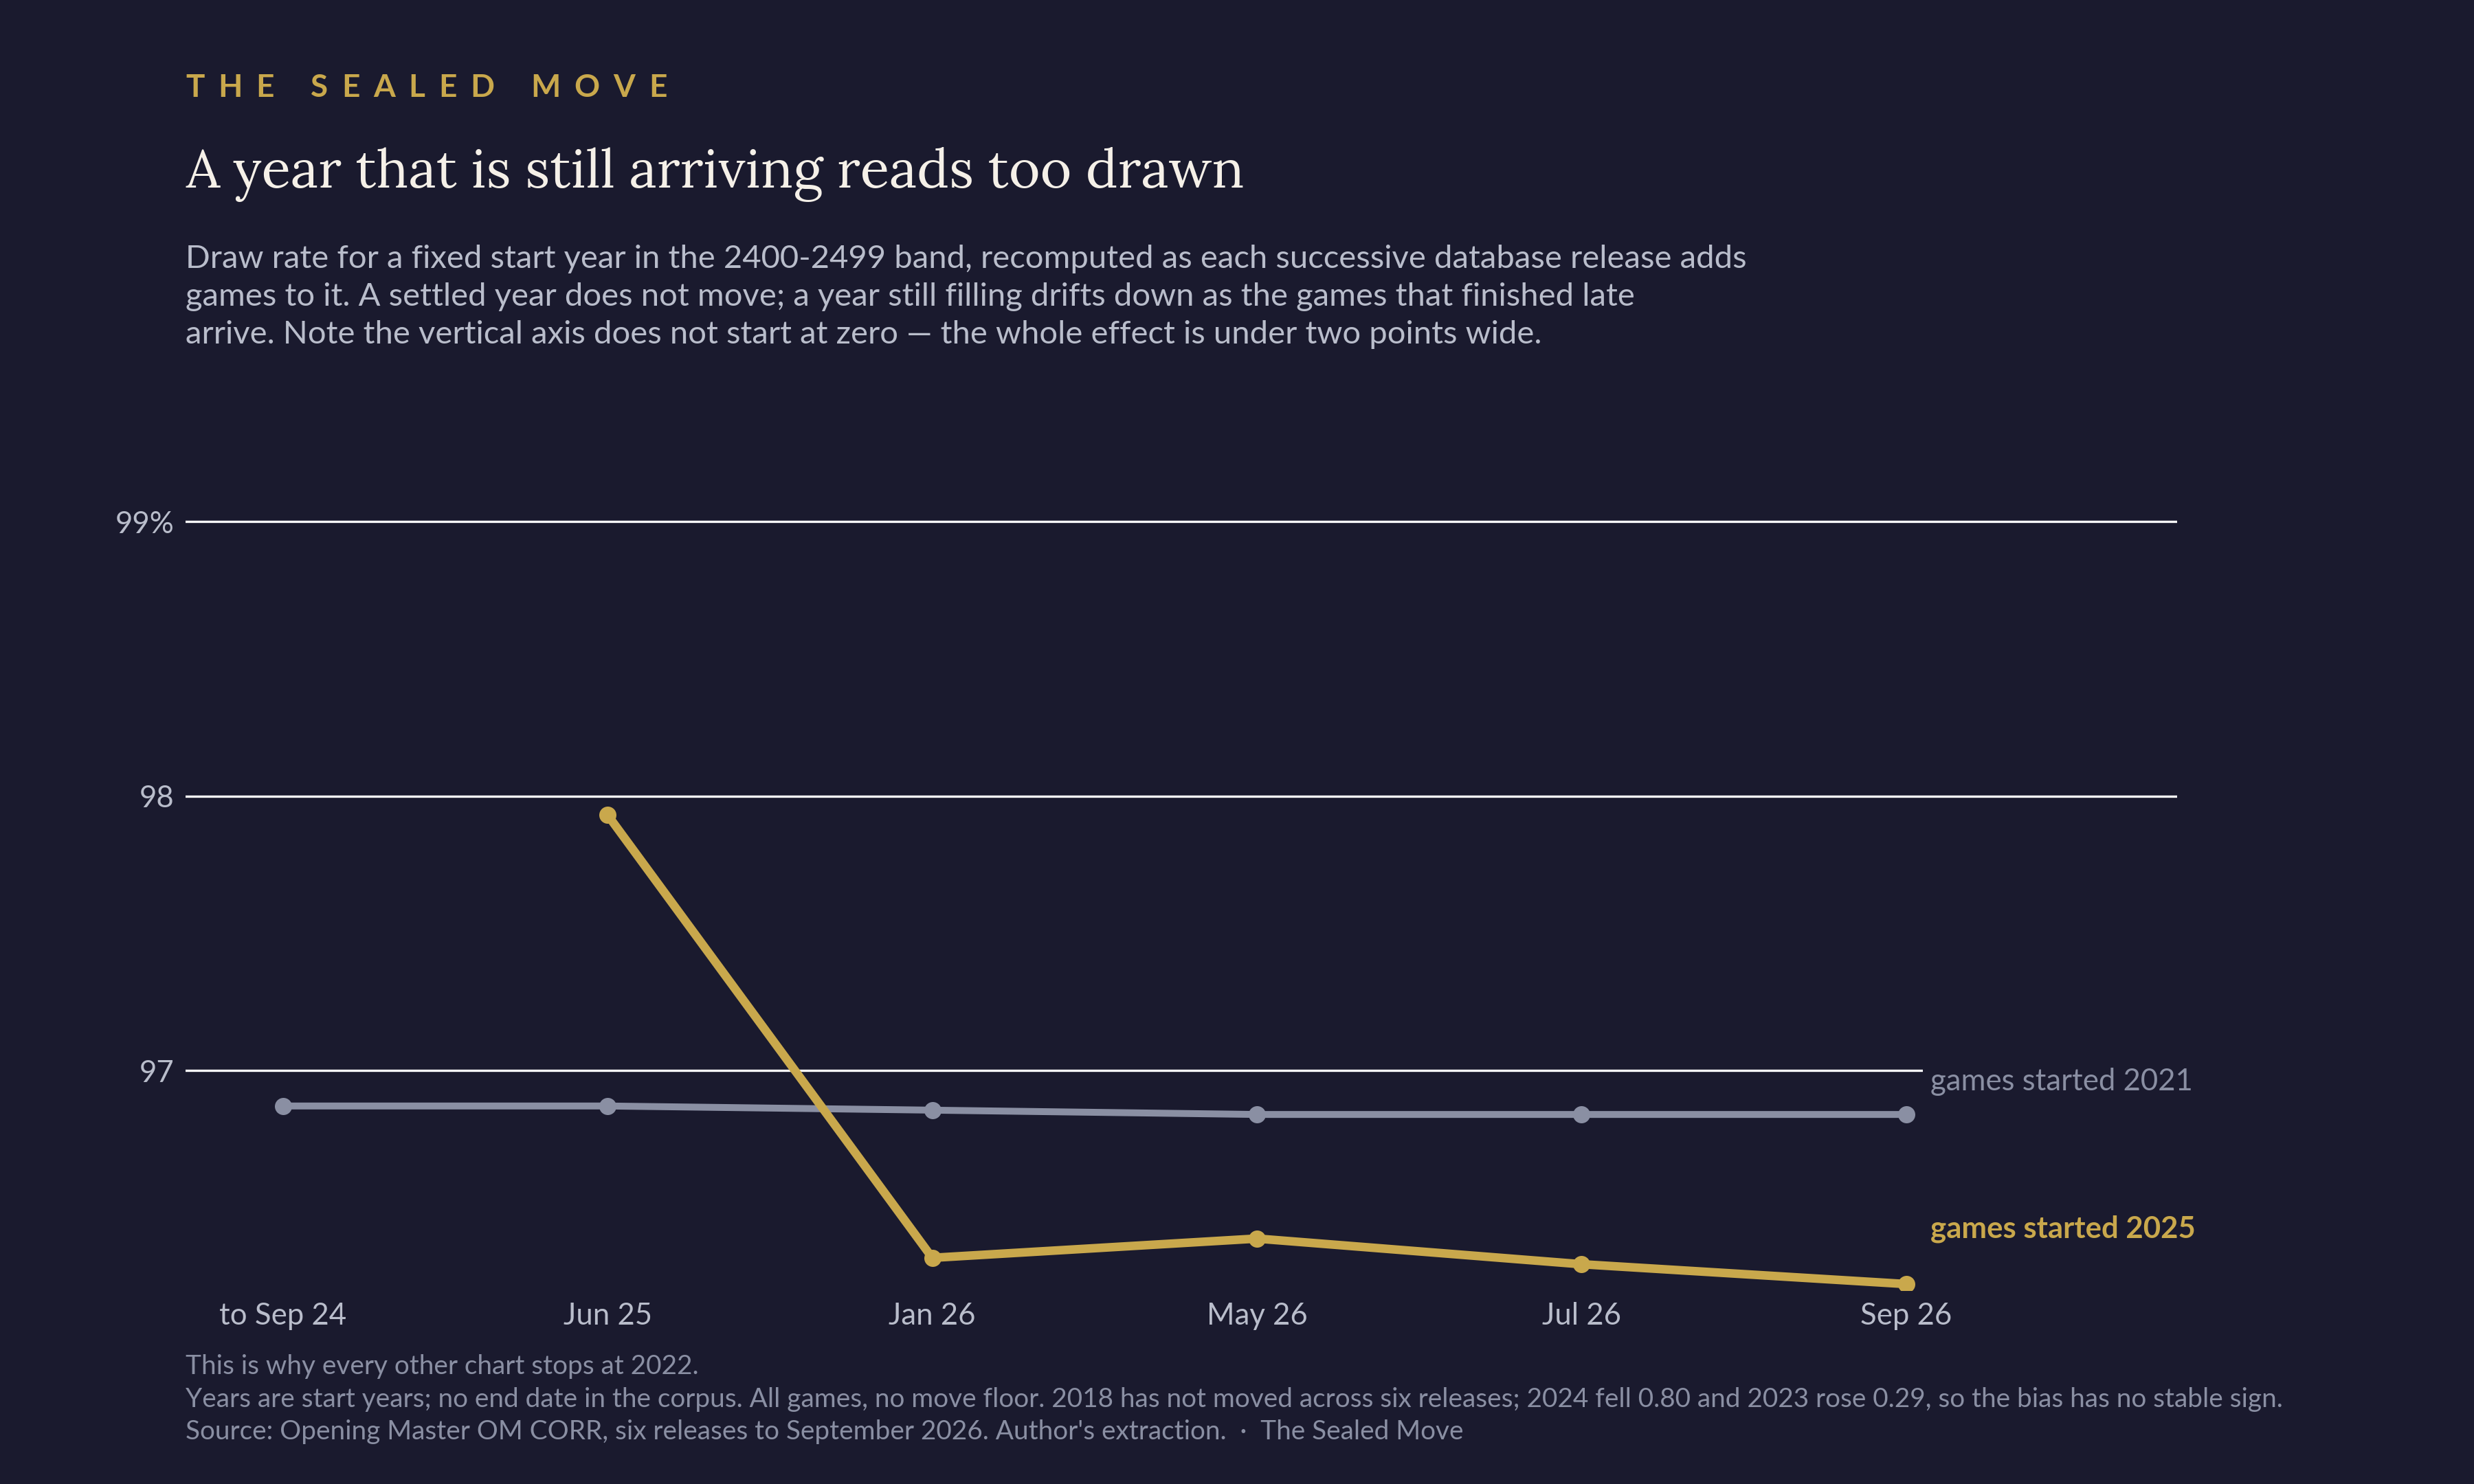
2018 has not moved at all and 2021 has moved by three hundredths of a point. 2024 has fallen eight tenths since it first appeared, and 2025 has fallen 1.71 points so far: in those two years the games that arrived late were disproportionately decisive, so an early view read too drawn (Figure 8). 2023 moved slightly up, and the corpus does not show why either way. A bias whose direction varies cannot be reliably corrected from five observations, so recent years are excluded instead of adjusted.
The move filter
As Section 2 showed, excluding games under fifteen moves removes a category that grew from 1.03% of decisive games at the top in 2012 to 20.39% in 2022, and it makes a level floor look like an eroding one. If you filter short games out of a correspondence database, as most of us do by habit because it is the right choice for over-the-board data, that is the change most likely to bring your numbers in line with ours.
A correction to Running From the Book
Running From the Book explained a jump in database volume in the 2400–2499 band as a single batch arriving through one release, and suggested a rating adjustment as the likely cause. Six releases show that both explanations were wrong. The games arrived gradually across all six releases, in roughly the same proportions as the neighbouring bands. In none of the five release-to-release transitions did any Elo value attached to an already-held game change. The jump itself is real, and larger than originally reported. The correction is published on that piece.
6. What the remaining board losses look like
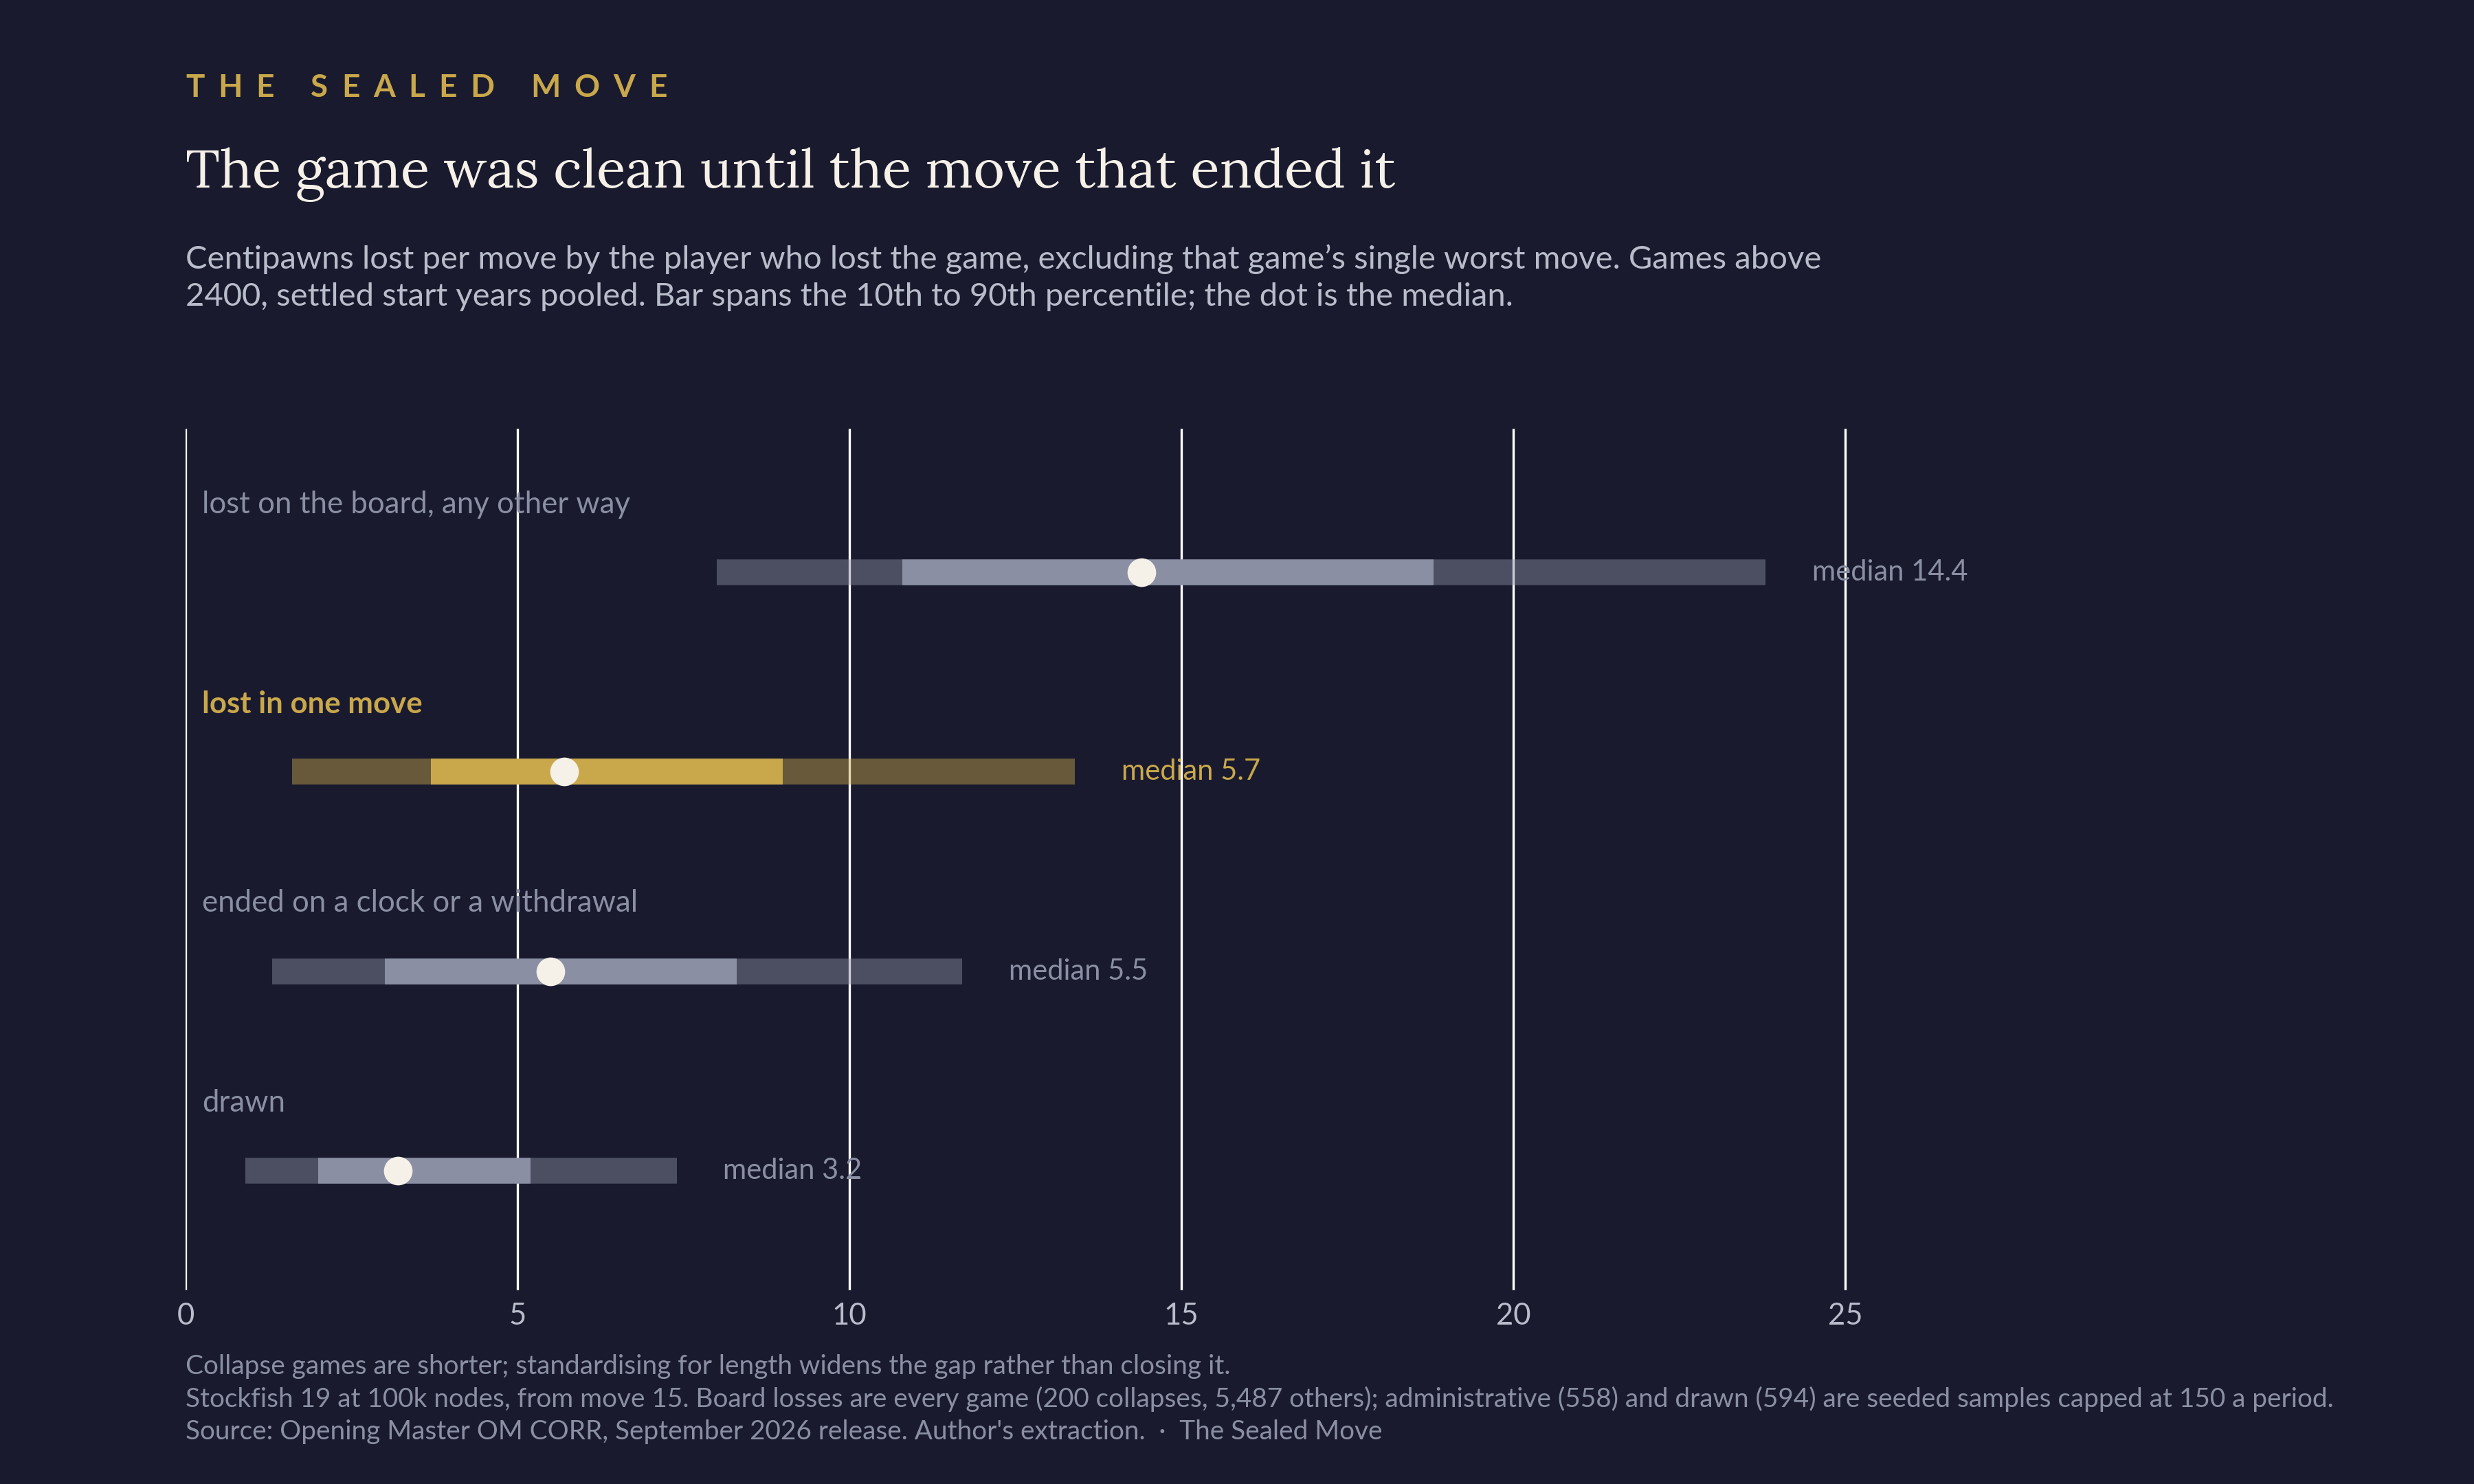
We analysed the average centipawn loss per move for games above 2400 as illustrated in Figure 9. Games that ended in a single catastrophic move were, up to that move, played to a standard indistinguishable from a game that ended on a clock (medians 5.7 against 5.5) and nowhere near one that was being lost over the board (14.4). Bars are the 10th to 90th percentile. Note that this data does not draw any conclusions about why the losing move was played.
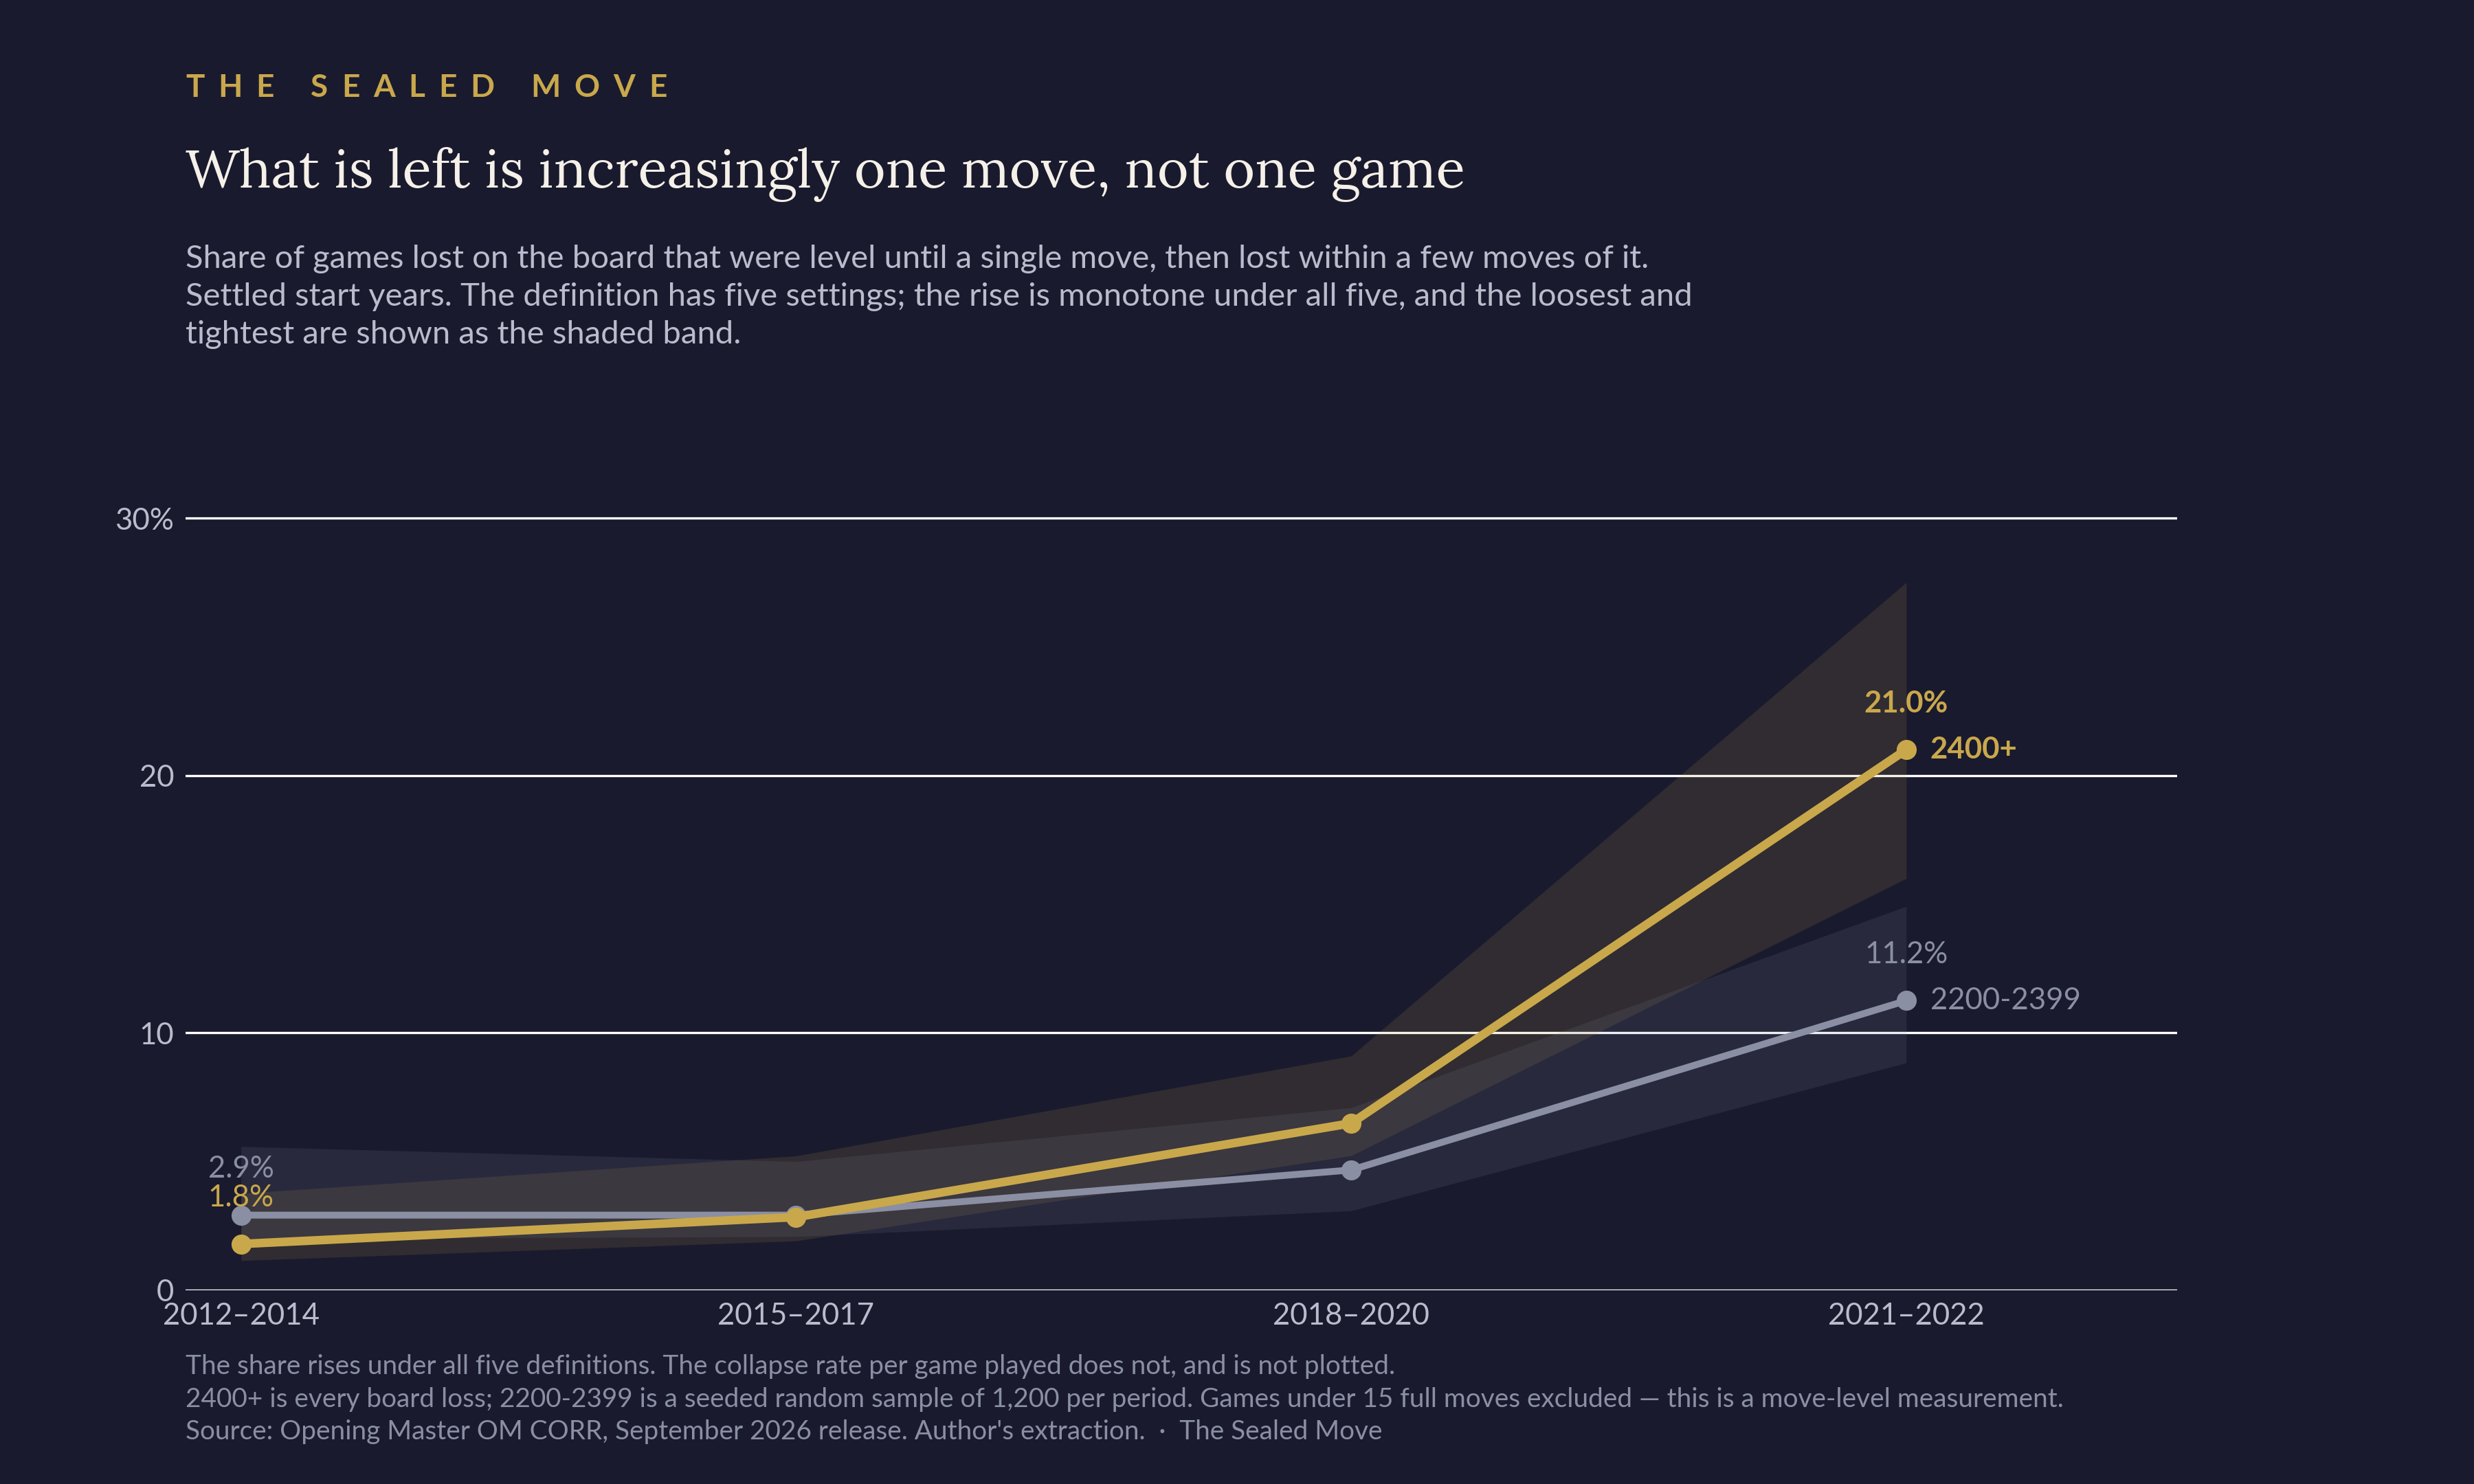
Section 2 showed board losses at 2400+ falling by 89.5% over the decade while the administrative rate shows no measurable decline. The question here is what the board losses that remain look like. During this same period, the share of board losses (i.e., decisive games excluding administrative decisions) won due to a single move (i.e., “blunder”) which took the game from level to lost has increased over time as shown in Figure 10.
Anatomy of ICCF “Blunders”
The data presented does not prove the mechanisms at play for each decisive game but is consistent with what ICCF players have reported seeing in their games. When games are decided, it is often that they are decided either by administrative events (e.g., timeouts) or rare unicorn wins on the board. The frequency of wins over-the-board has been shrinking, and when they occur, a growing share of them appears to be quick losses resulting from human error rather than the accumulation of an advantage by one side or the other.
We can give some examples from ICCF games to illustrate what these blunders look like and try to categorise them. Simple human-errors can occur due to carelessness when tired, distracted, or playing too many games simultaneously. Even in an ICCF environment that permits engine use, there is still a frequency of human errors that naturally occur which will come as a random gift to players. The examples selected to illustrate these types of blunders are from games played by IM Tedesco or his opponents over a range of levels above 2300.
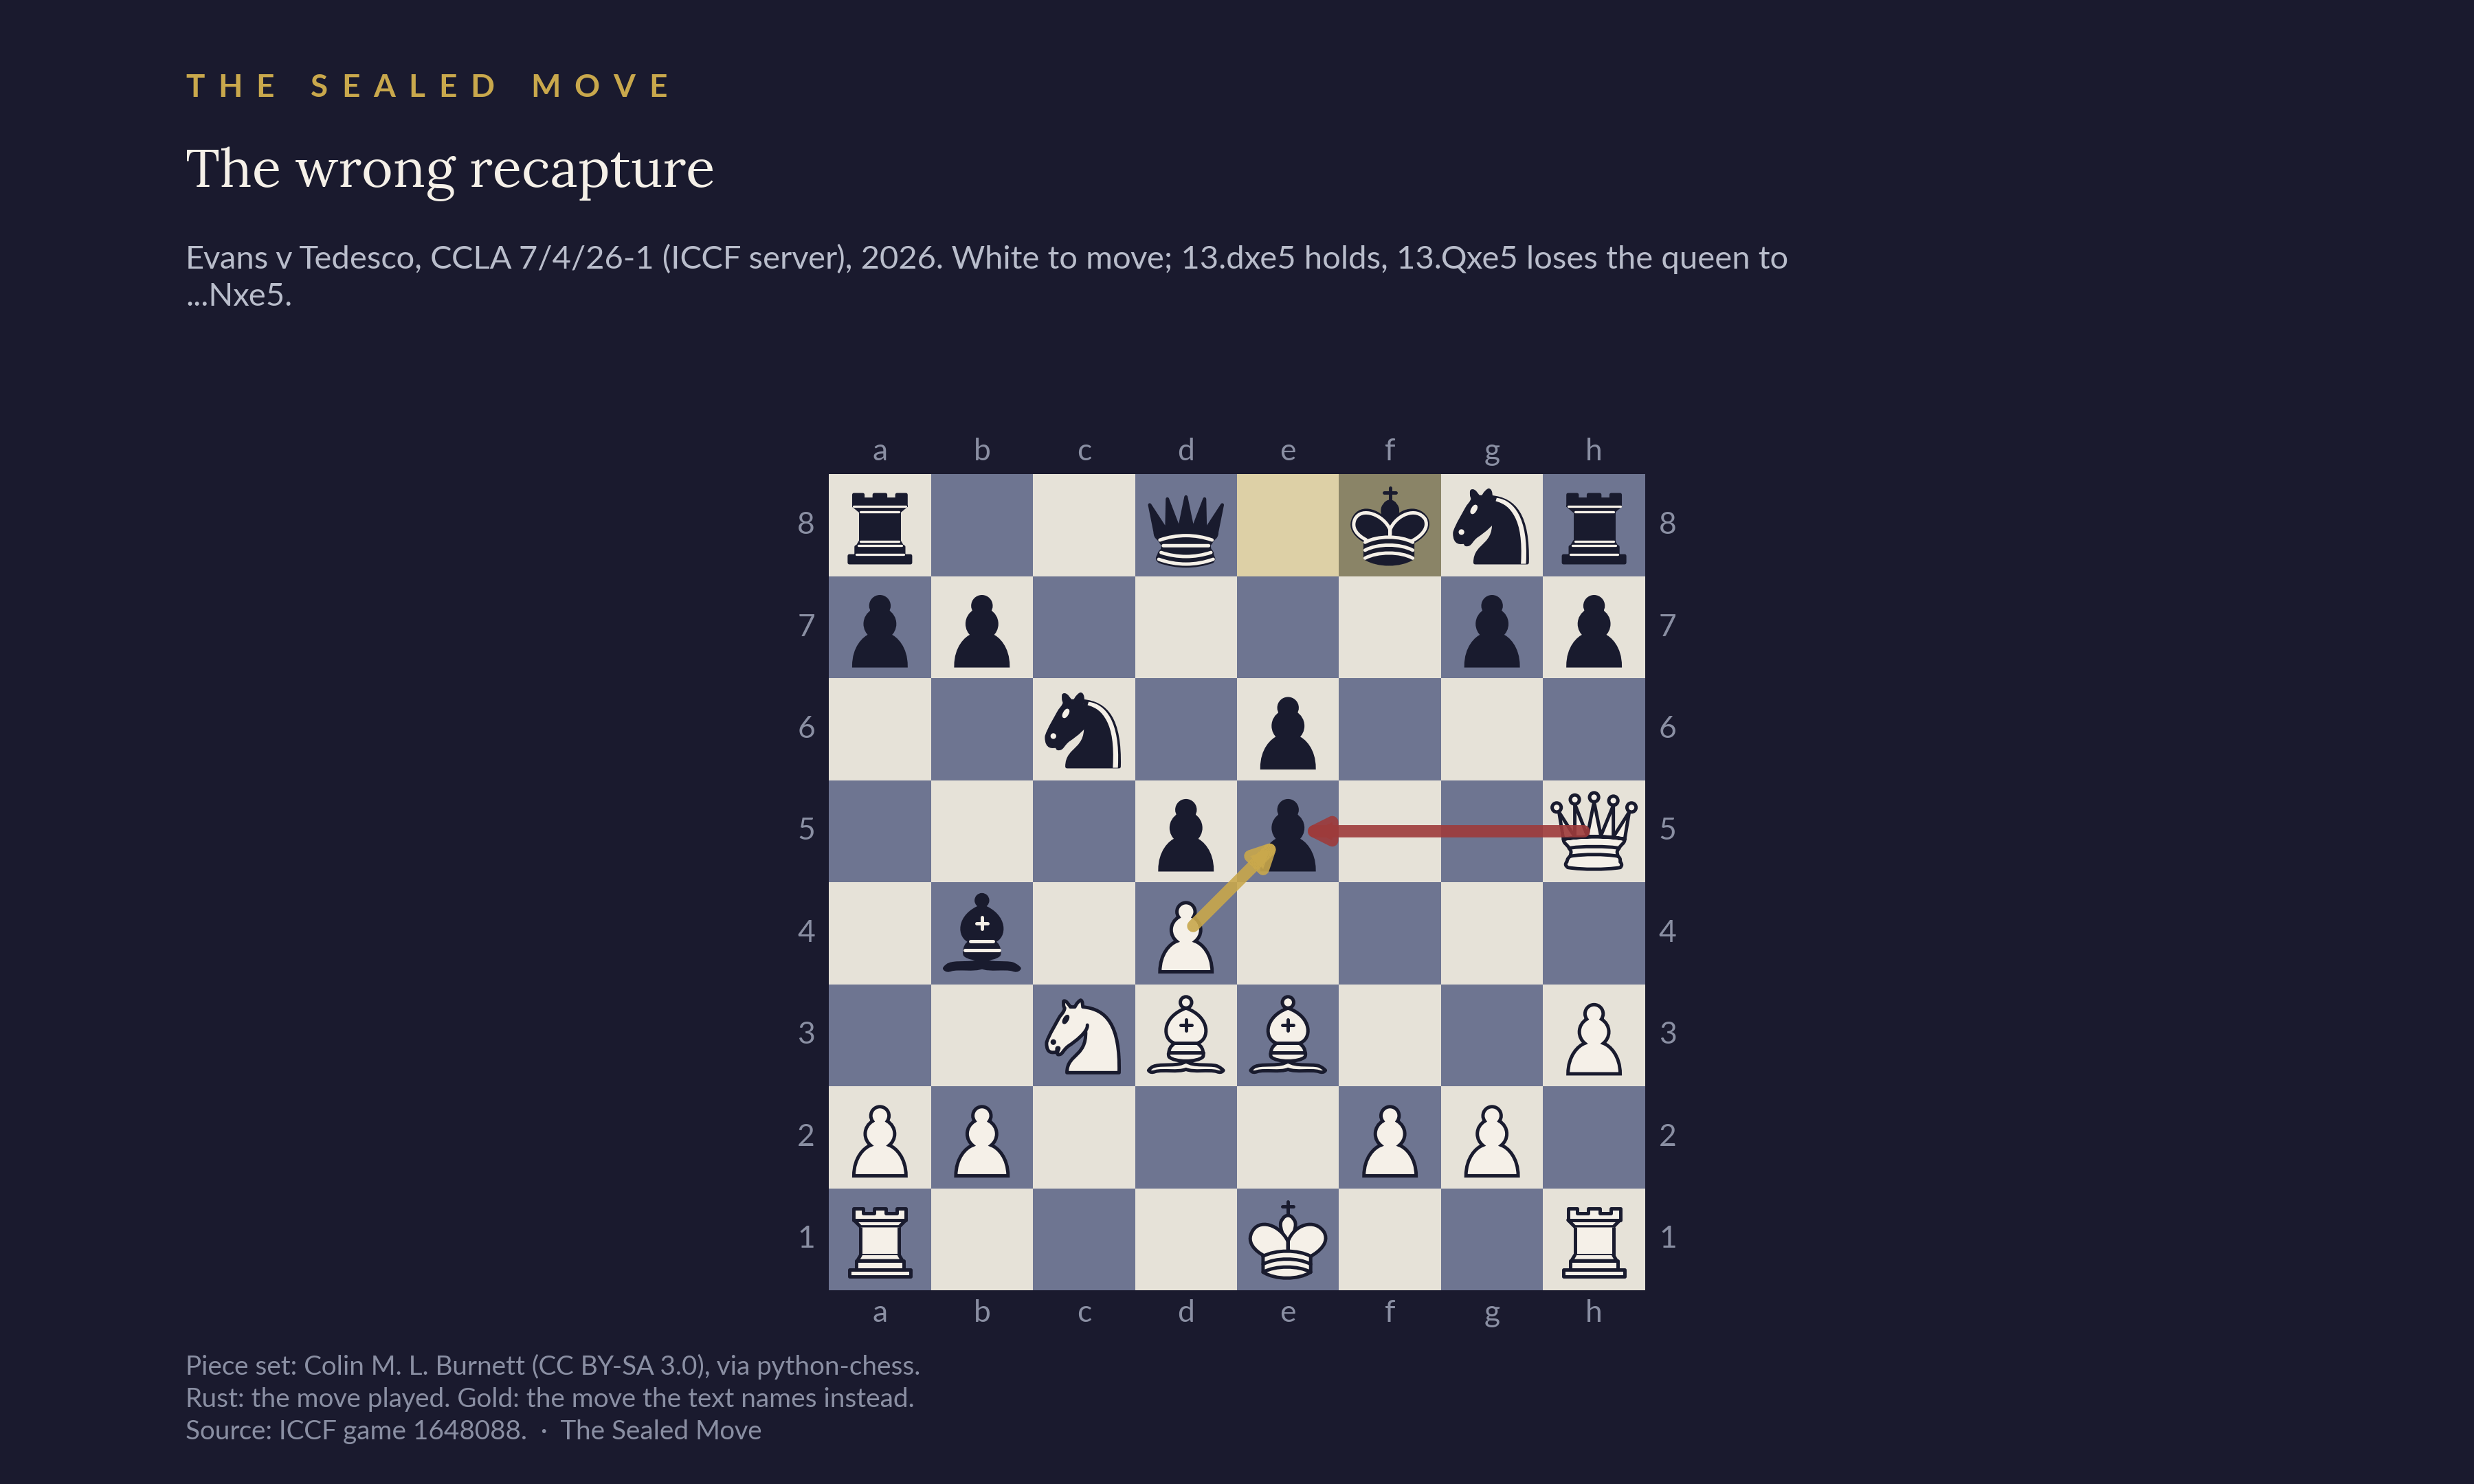
A Simple Blunder – The Wrong Recapture: In this recent game, Correspondence Master Evans played 13. Qxe5 rather than the correct dxe5 losing the game on the spot from an otherwise 0.00 position as shown in Figure 11. After the game discussion, it was clear that the player had been tired and should have waited for another time to transmit moves. It is possible they were looking at a line that involved a subsequent Qxe5 when they made their move on the server. But what is clear is that this game was lost due to human error and not anything to do with “chess skill” or “chess knowledge.” This player would never play Qxe5 under ordinary circumstances. After Nxe5 there was no recovery for White. This example is comparable to a blunder you might see from an opponent in a classical game under severe time pressure. Numerous examples of blunders from top players in classical chess can be found in the databases. This is not unique to ICCF play.
Game: https://www.iccf.com/game?id=1648088
Model Game Deviation: Sometimes a player enters a move from a model game they have been analysing rather than the actual game on the board and fails to play the correct response to a game deviation. In this recent example IM Tedesco as White is our victim. The players had the same opening in a game they had previously played in 2024. That game ironically was also decisive due to an error by IM Schulz. Both players were expecting to deviate at some point. In the recent game, White blundered with 13. Ne4 rather than the correct 13. Be2 after his opponent deviated with 12…b5 as shown in Figure 12.
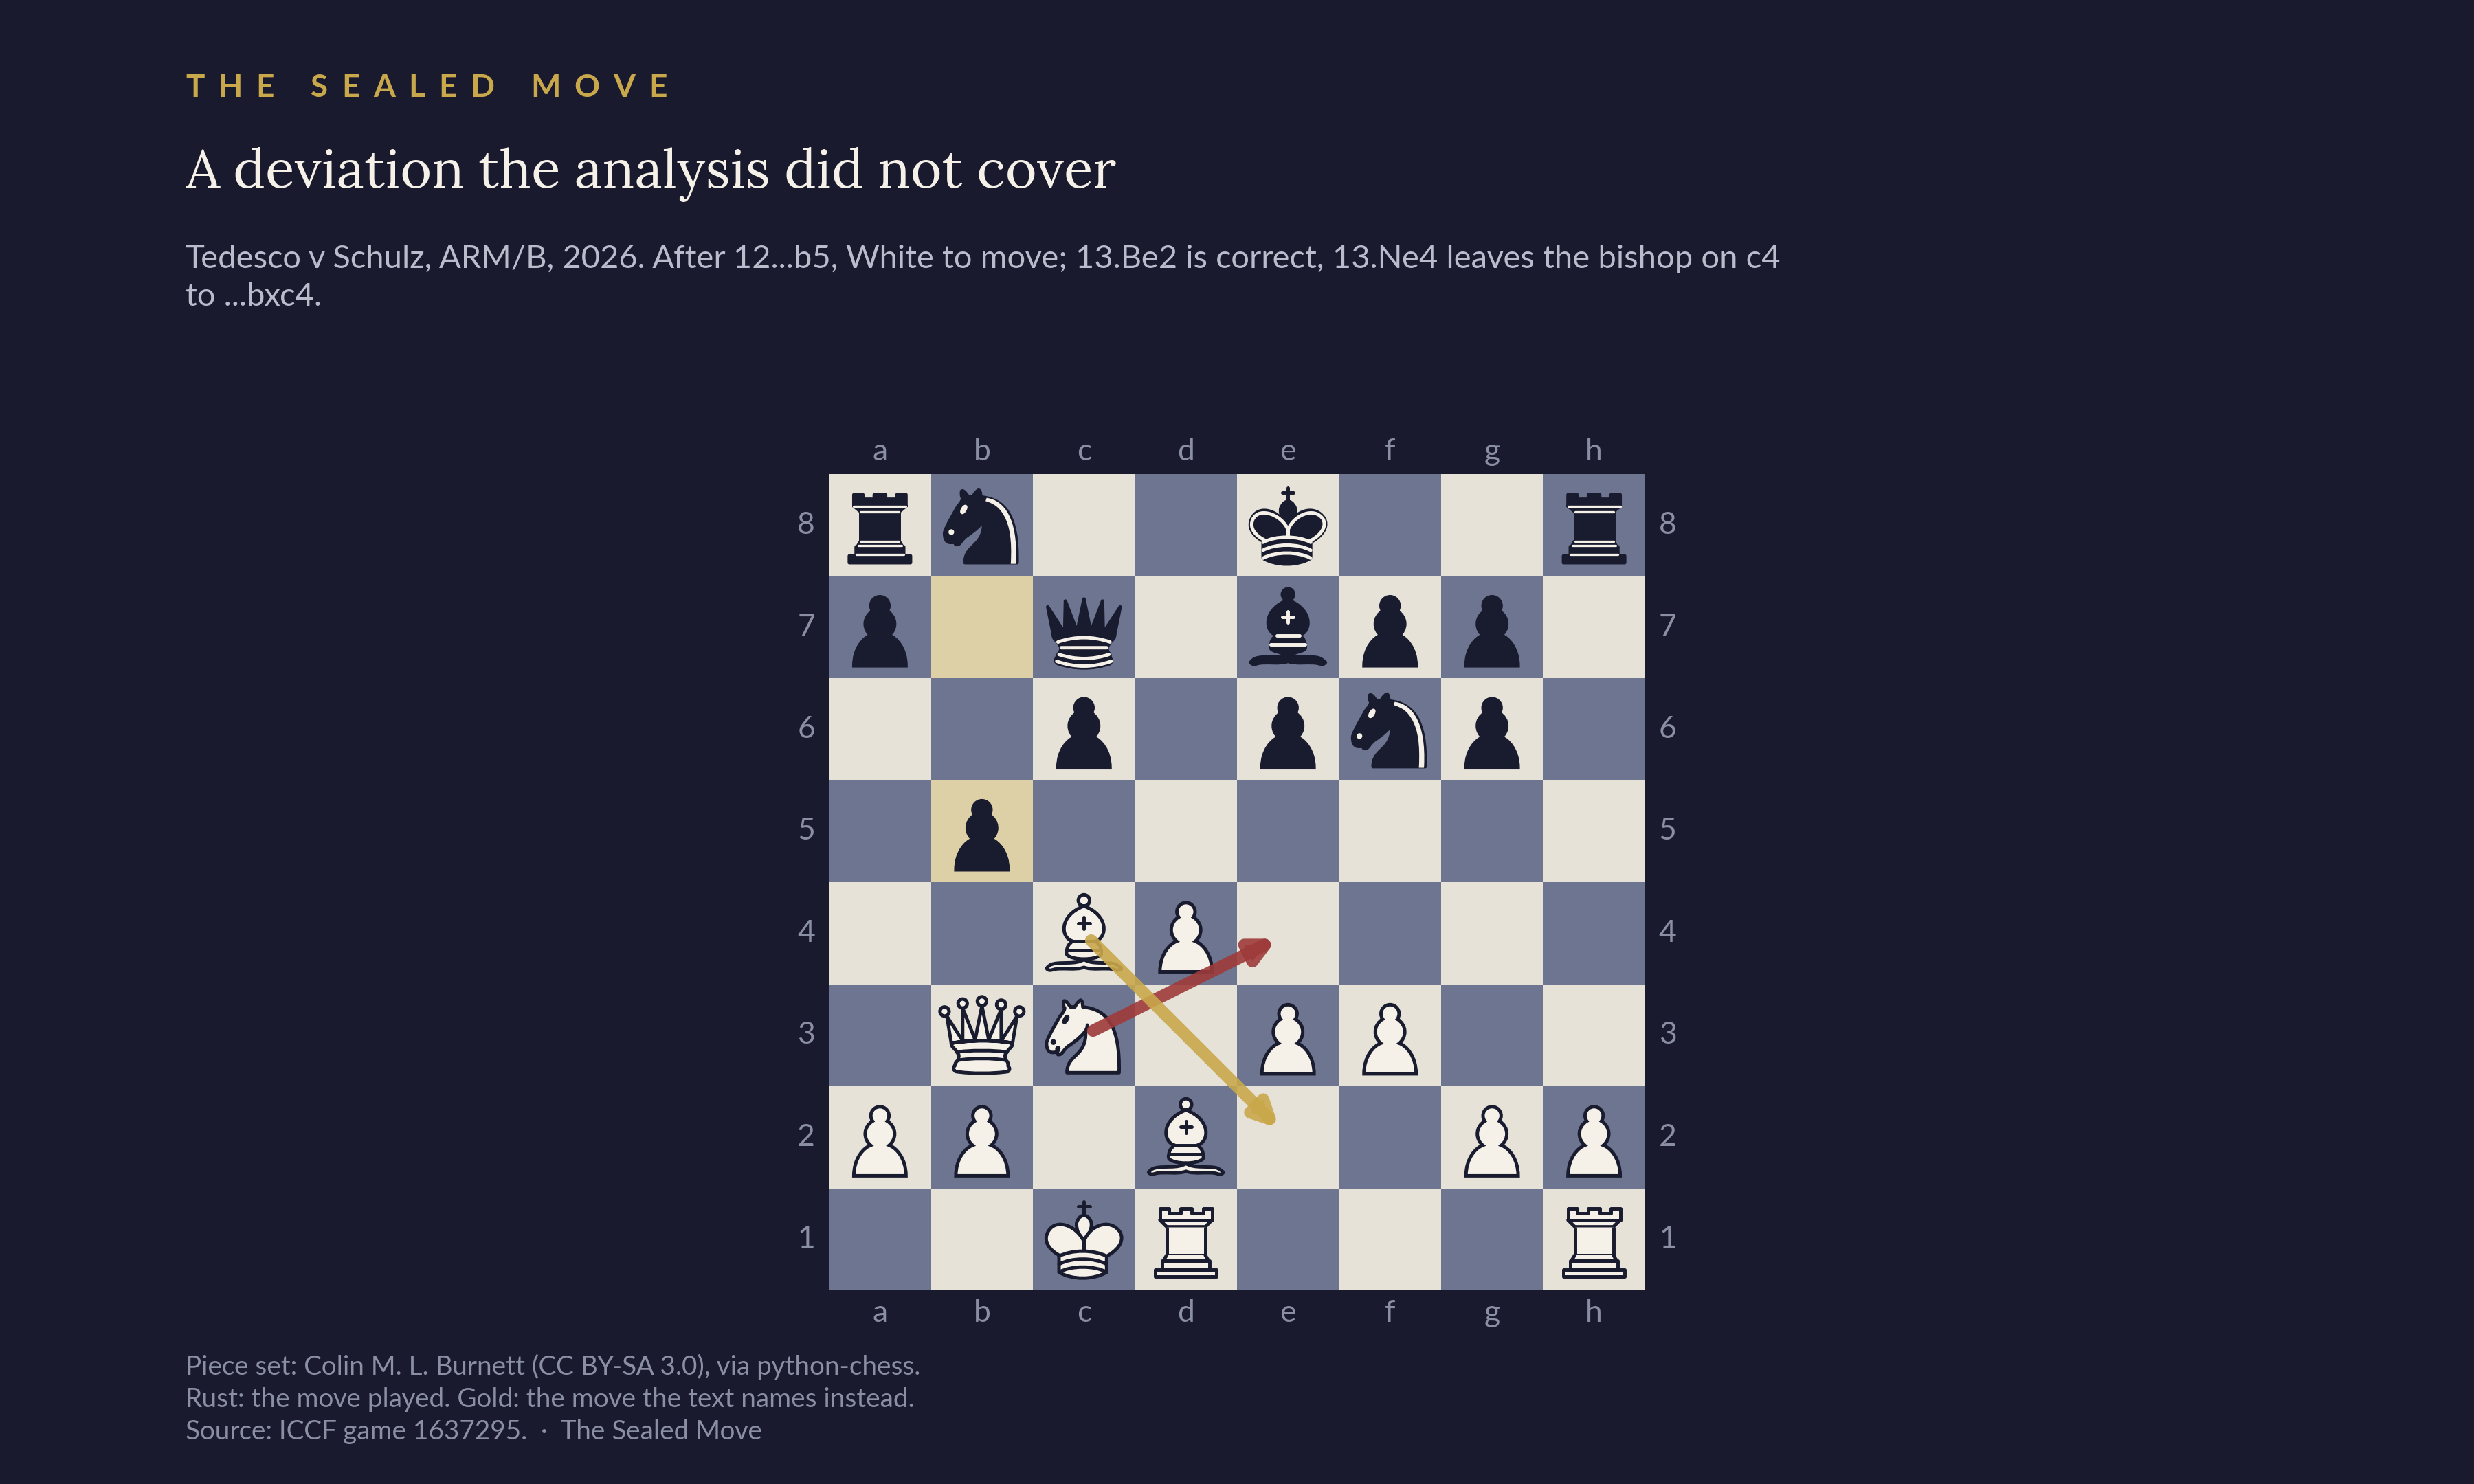
In their previous game the move order had been different featuring 12…a6 13. Be2 b5 14. Ne4. White had convinced themselves the position was the same as after 12…a6 13. Be2 b5 rather than the new deviation from that game after 12…b5. This does illustrate one good strategy for creating your own luck. Find move order deviations from recent model games that might trick a tired or distracted opponent into making a similar error.
Game: https://www.iccf.com/game?id=1637295
Game: https://www.iccf.com/game?id=1455521
In another similar example, IM Tedesco’s opponent had been analysing a version of the game where White had played 14. Rc1 but in the actual game White played 14. Rd1. The actual game continued 14. Rd1 e6 15. dxc5 Qxc5 16. e4 Nf6 17. exd5 Qxd5 18. Nc4 Qc5 19. Nd6+ when Black realised they were now worse. Those same moves would lead to a position that is fine for Black had White played 14. Rc1. What we discovered during the postmortem was that Black had been analysing the same line with 14. Rc1 rather than Rd1 and did not even see Nd6+ was a possibility. When entering their moves on the server they never noticed the board position was different from their analysis as shown in Figure 13. SIM Vohl noted after playing the move that he was analysing the game with 14. Rc1 and now wondered how 19. Nd6+ was even possible.
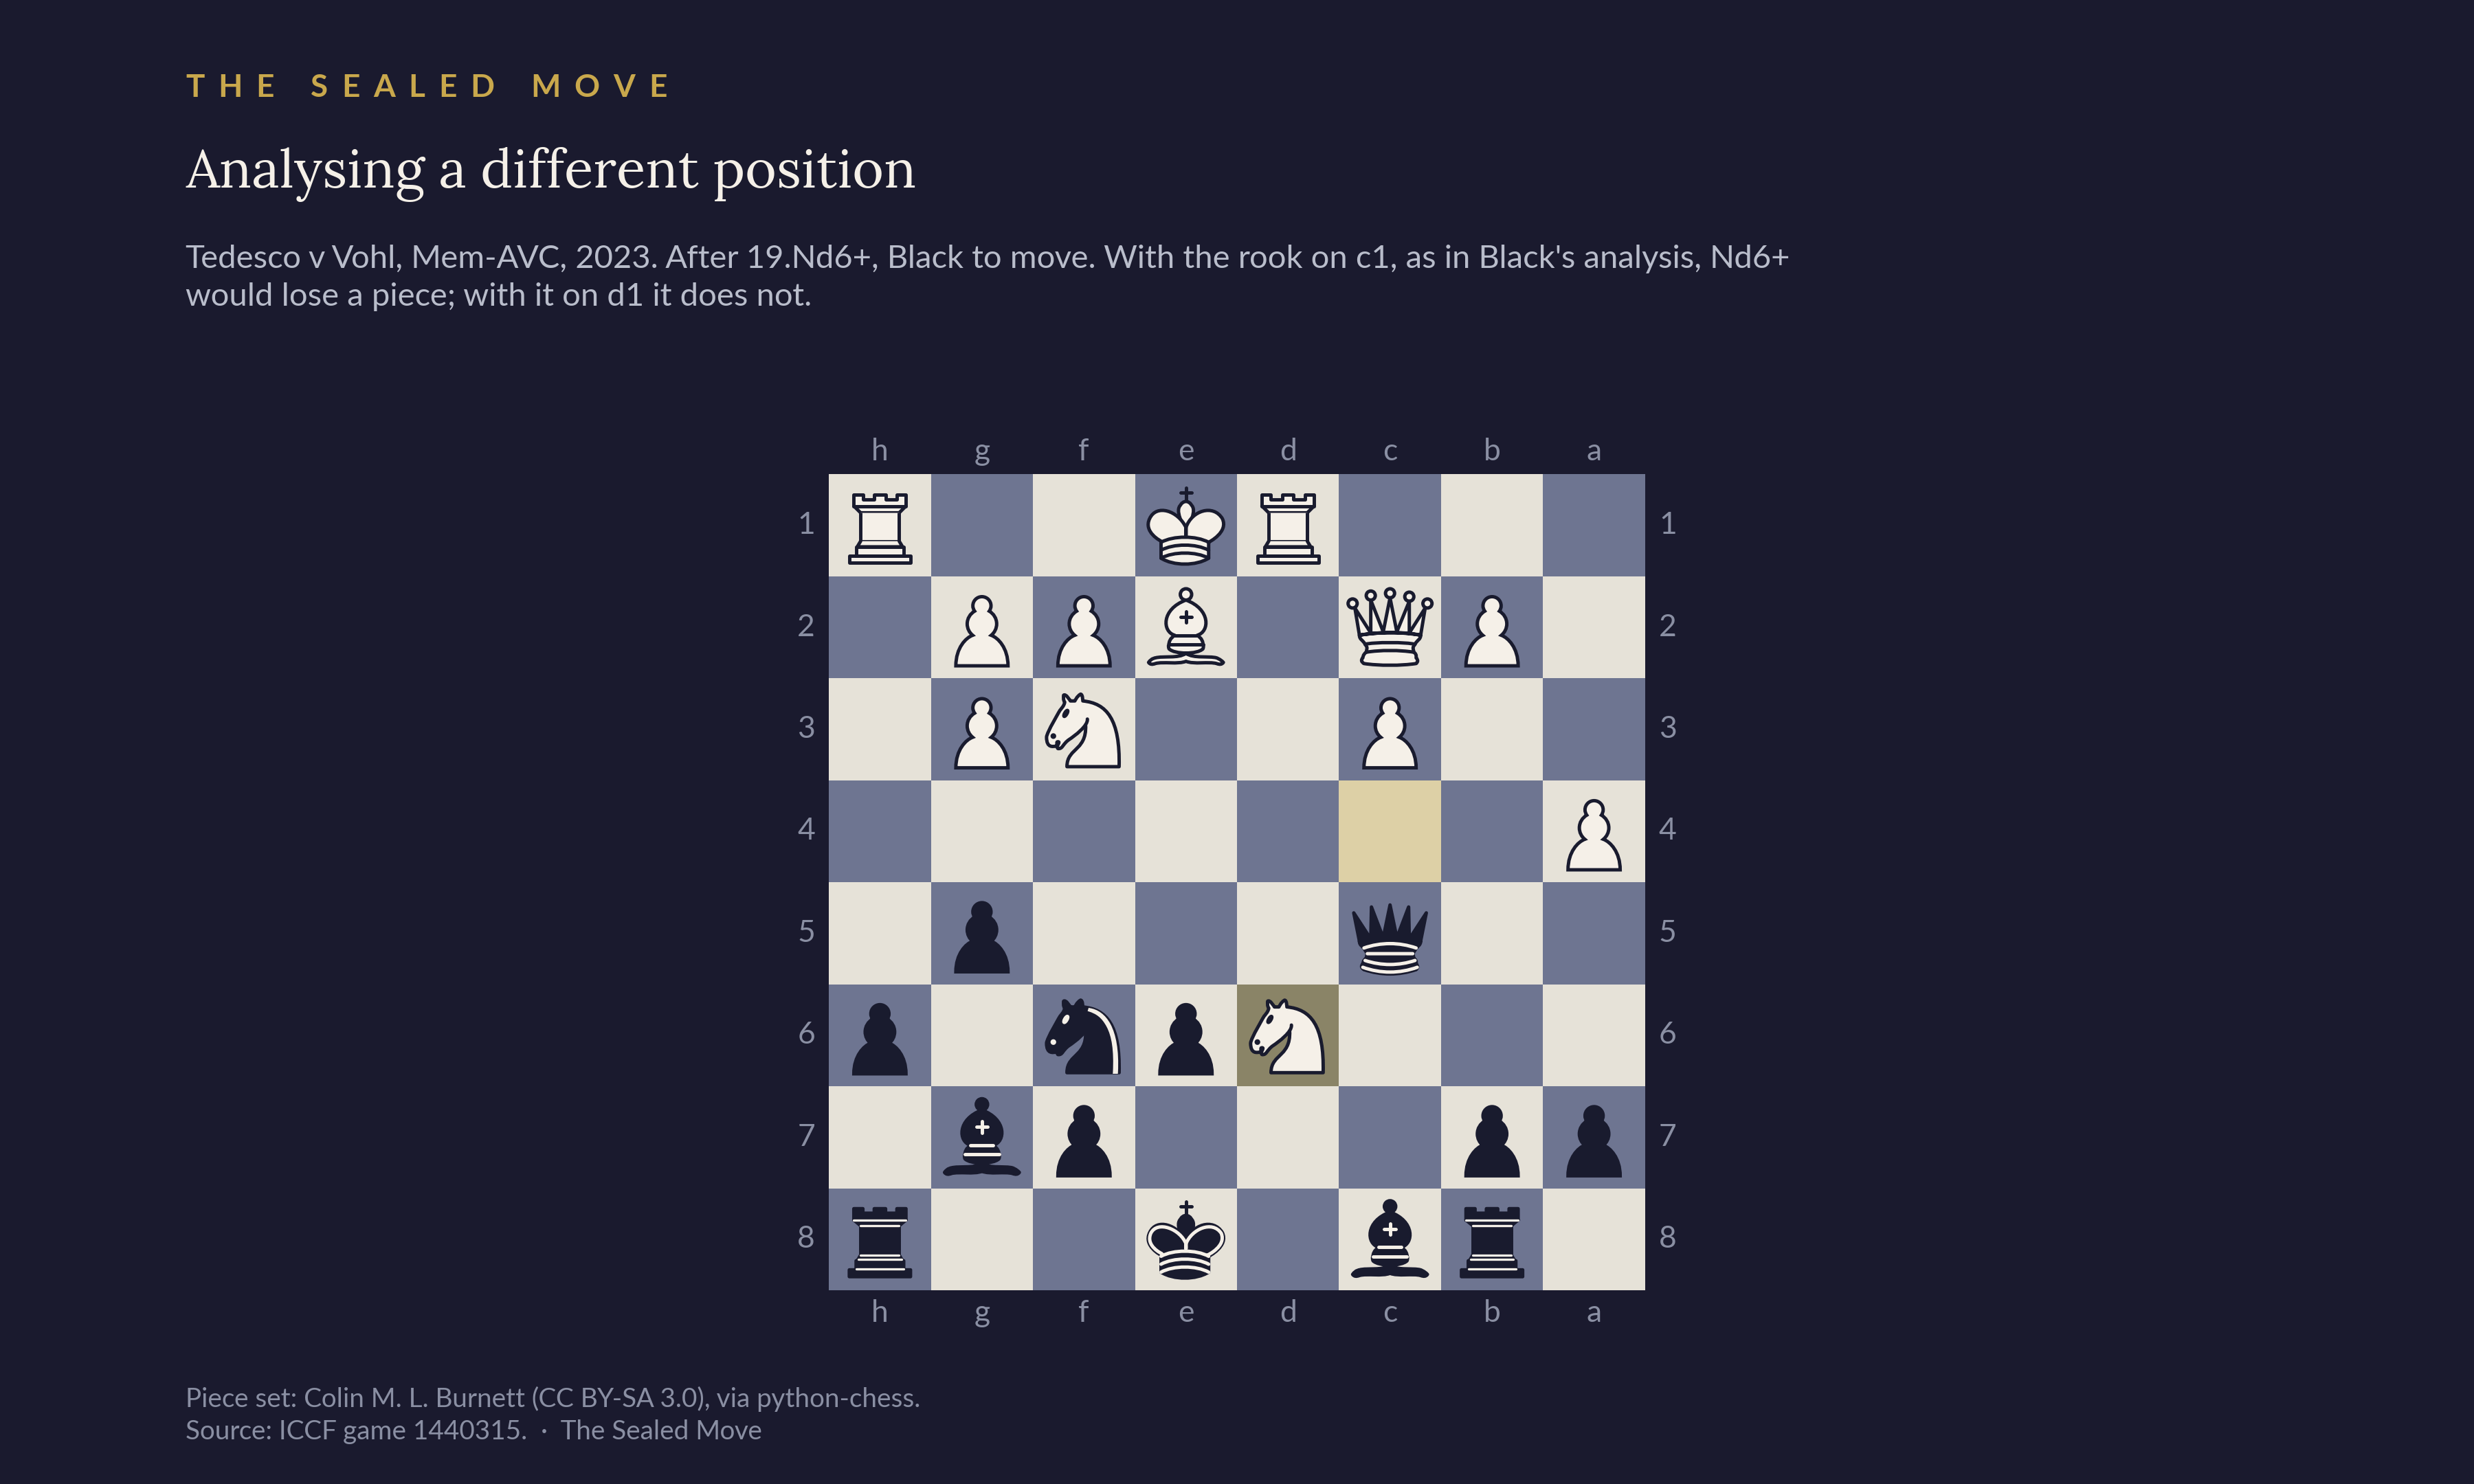
Game: https://www.iccf.com/game?id=1440315
Getting Ahead of Ourselves: We have also seen examples of related blunders when players enter a move into the server that is the correct move one or more moves further in their game analysis or repertoire. When discussing a loss by IM Tedesco to his opponent CCM Ziegler in 2020, CCM Ziegler shared an example of his own. On move 52 Black played…Be5 when he intended to play 52…Qxc1 53. Nxc1 Be5. He made the Be5 move one move earlier following an out of sync game analysis and lost a “won game” in a single move as shown in Figure 14.
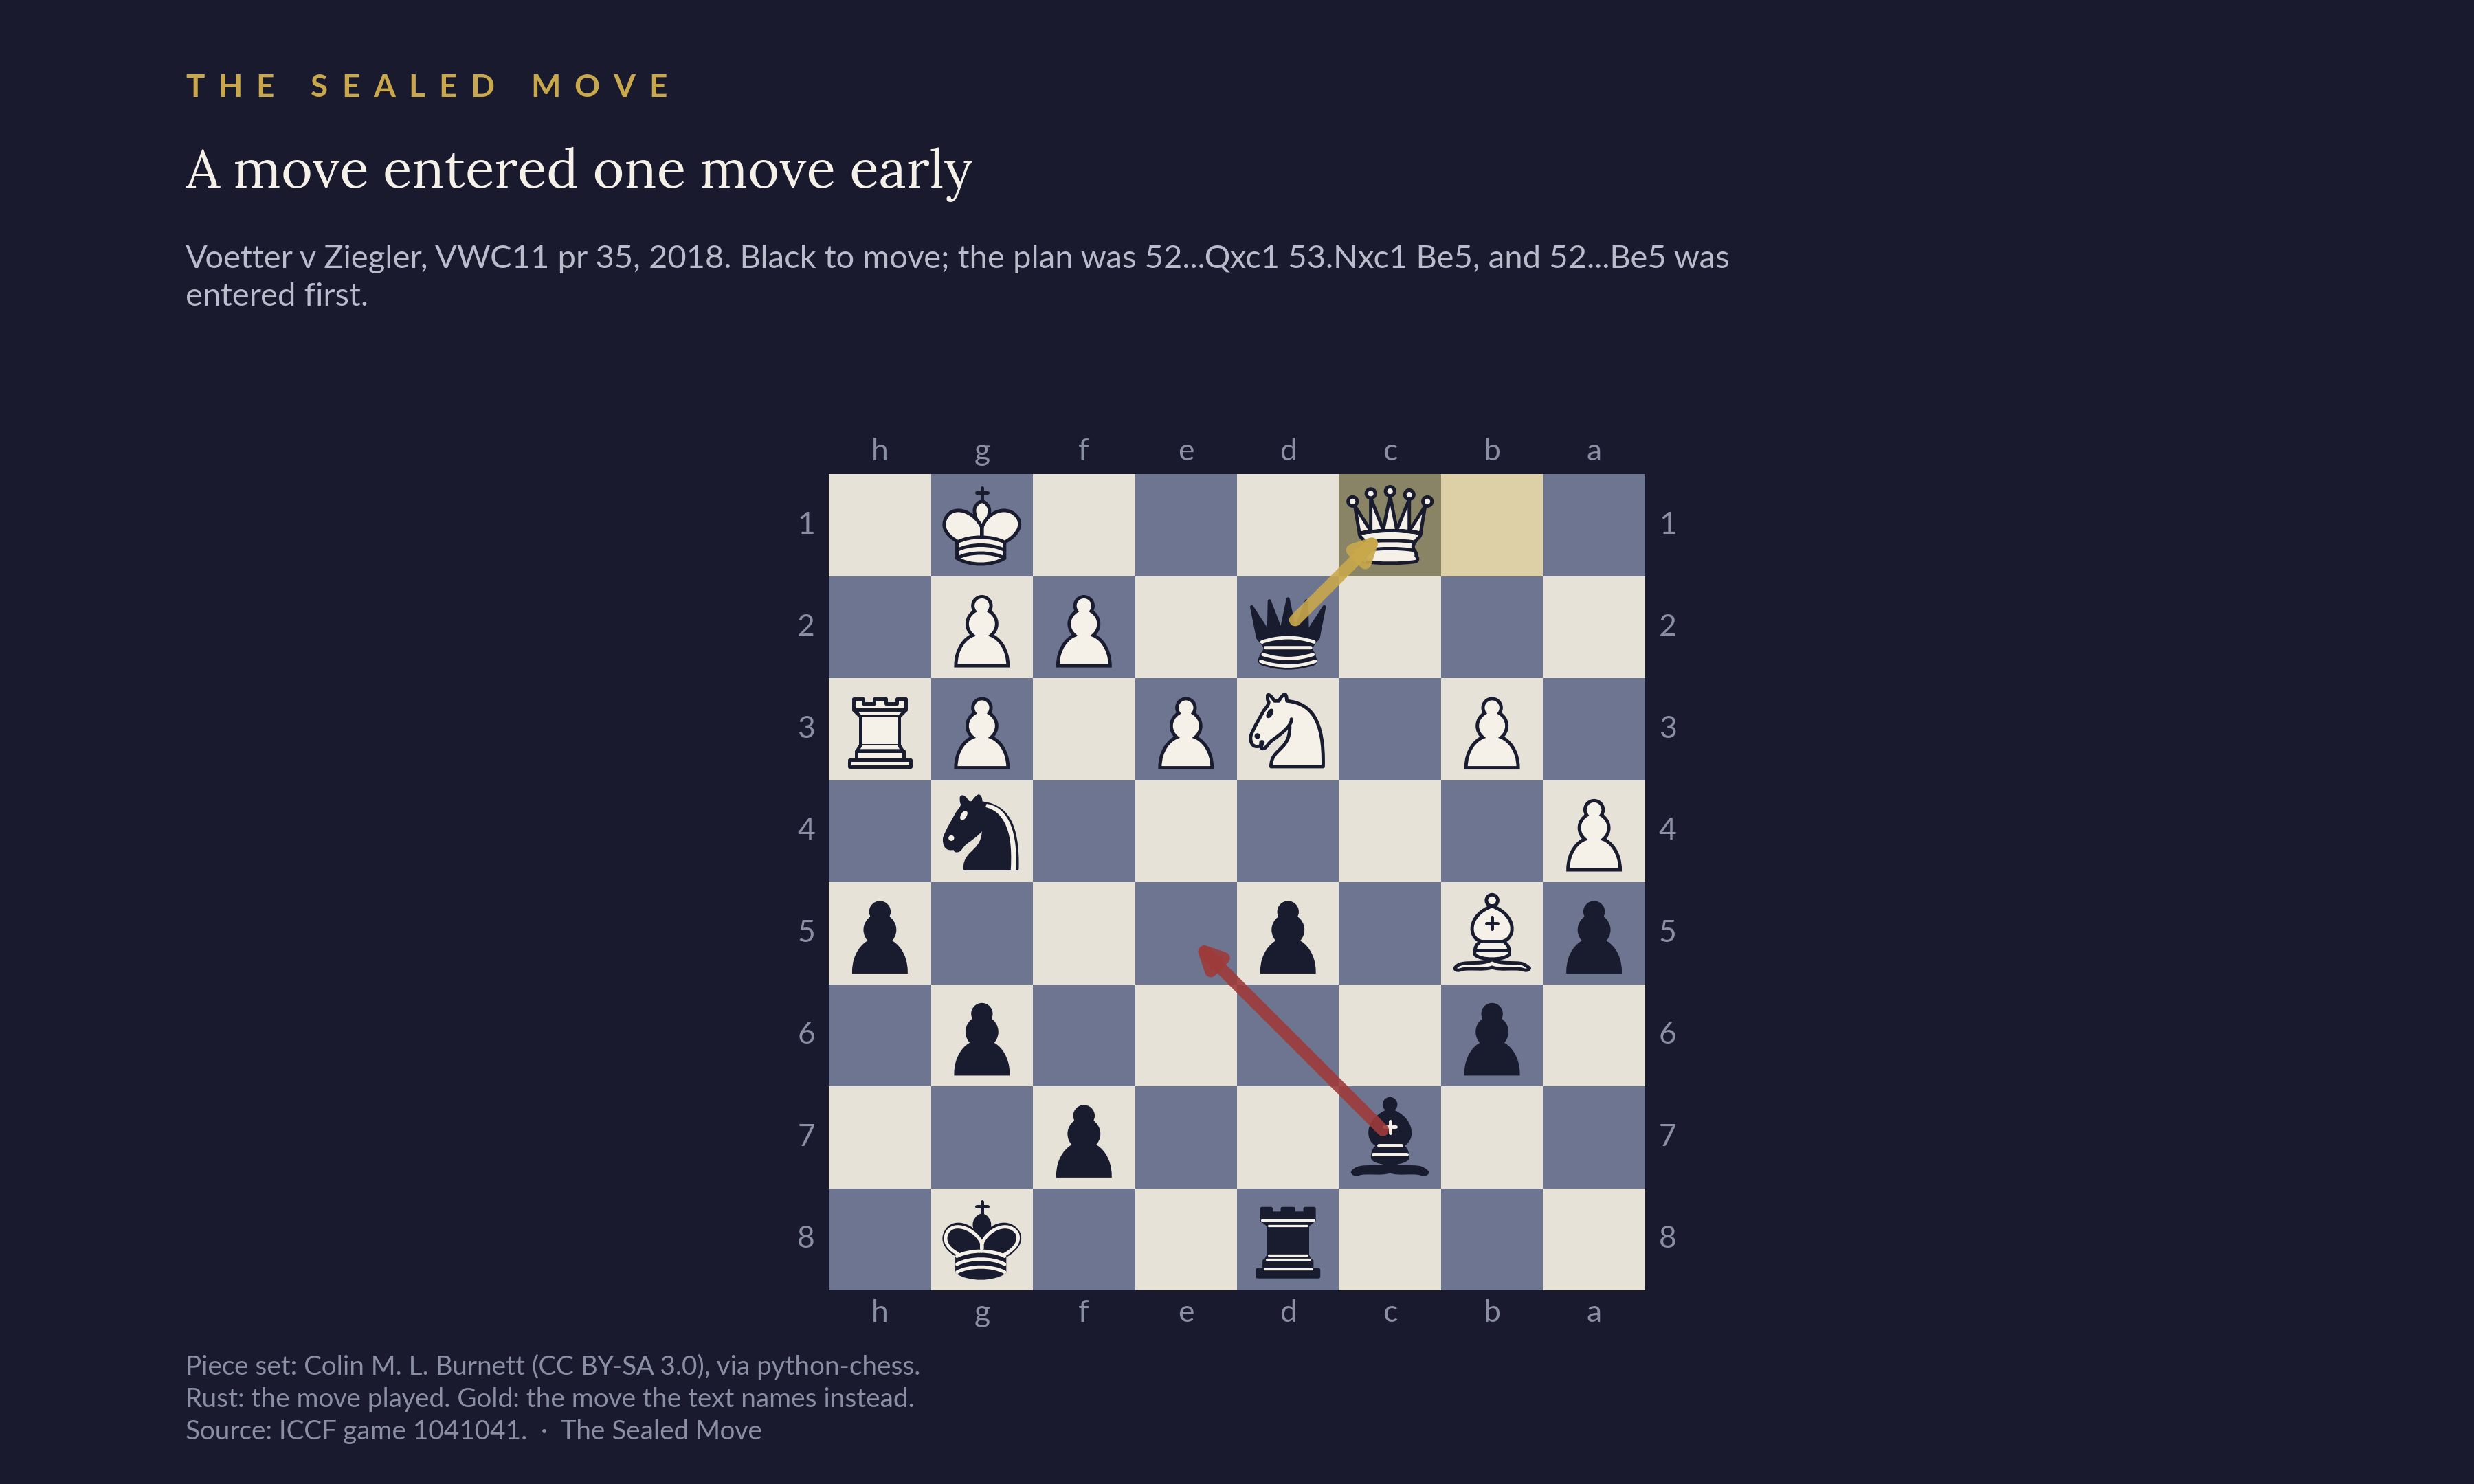
Game: https://www.iccf.com/game?id=1041041
Right Piece, Wrong Square: In the original game from 2024 referenced in the Model Game Deviation discussion (Tedesco–Schulz, CL/2024/B2, 2024) IM Schulz as Black had gifted White with a win in the same opening by playing 27…Nf5 instead of 27…Nc4. This took the evaluation from roughly equal to completely winning for White in one move as shown in Figure 15. The game continued in this case to move 42 when Black finally resigned, but it was lost after the blunder at move 27. During subsequent discussion, it became clear that they had correctly analysed the position and had fully intended to play the engine recommended Nc4 but for reasons that were not entirely clear (likely tired or distracted) they entered Nf5 on the server.
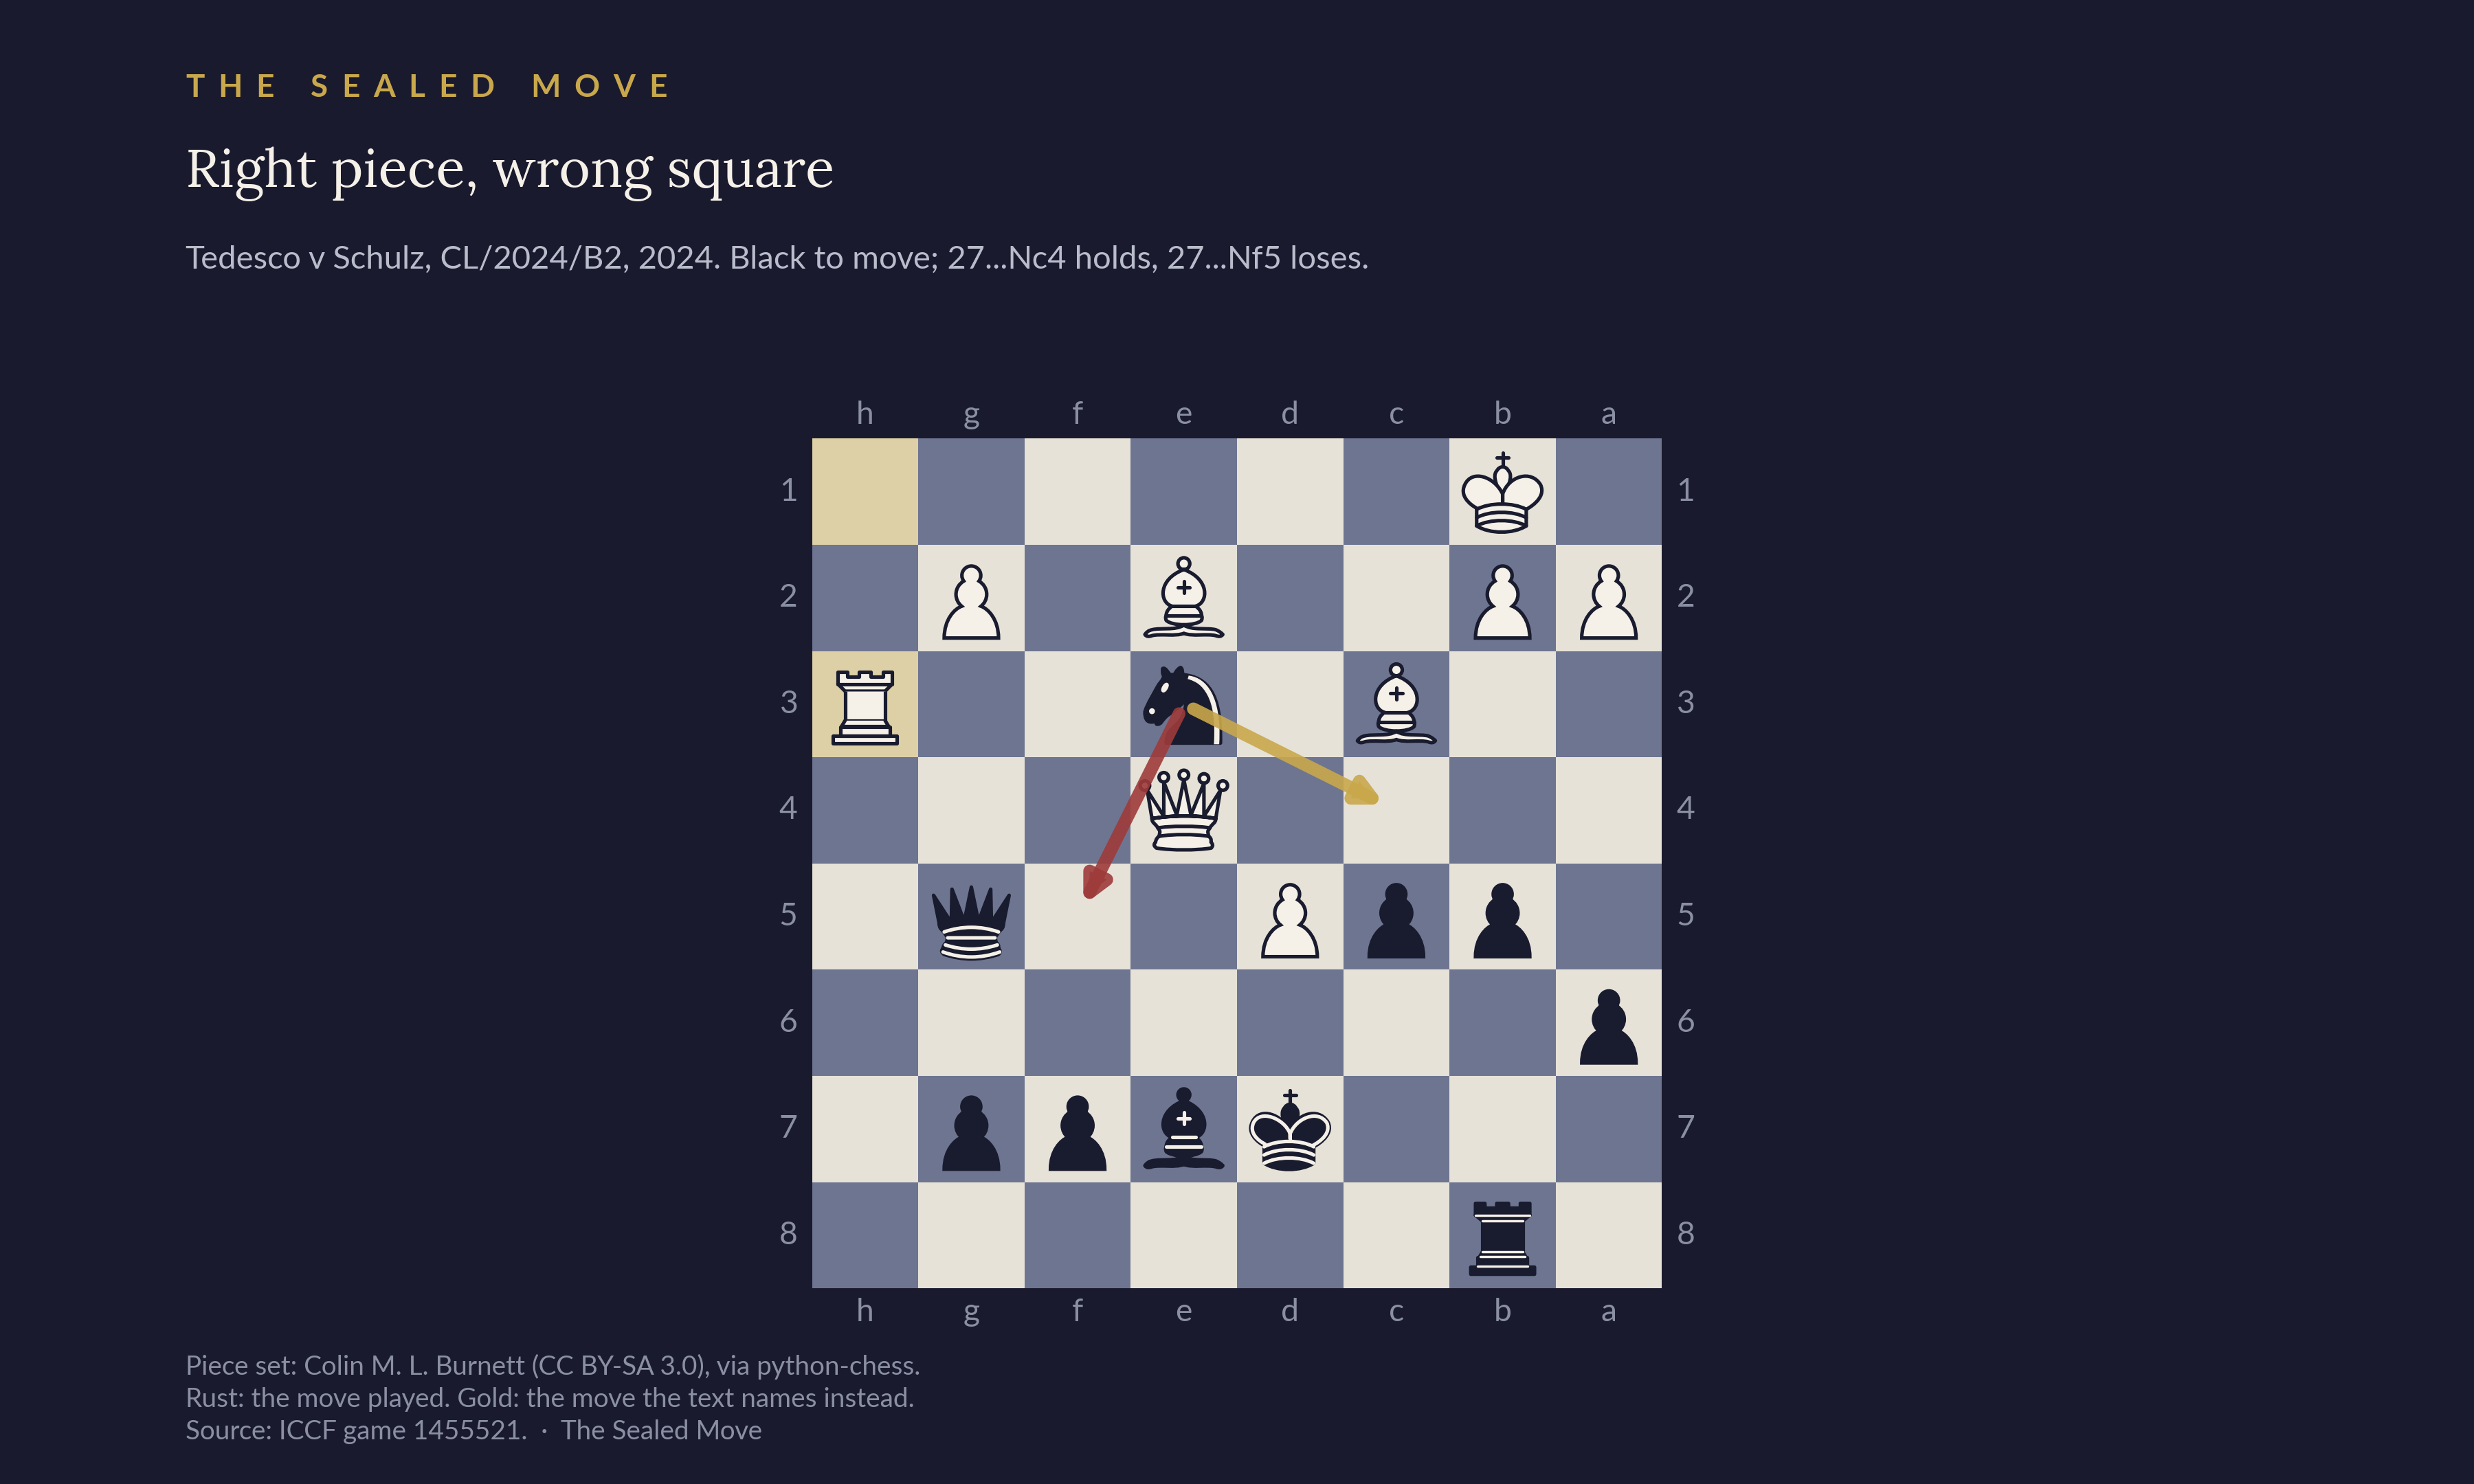
The authors have seen repeated examples where the correct piece from the primary analysis line is moved by the player to the wrong square. Anecdotally this suggests that if you have a choice of equal candidate moves, encouraging a knight relocation may be a practical choice. Analysis of the CORR database showed that right-piece-wrong-square blunders account for close to a third of the collapse moves the classifier could assess (420 of 1,290).
Recent Top Events Show the Same Patterns
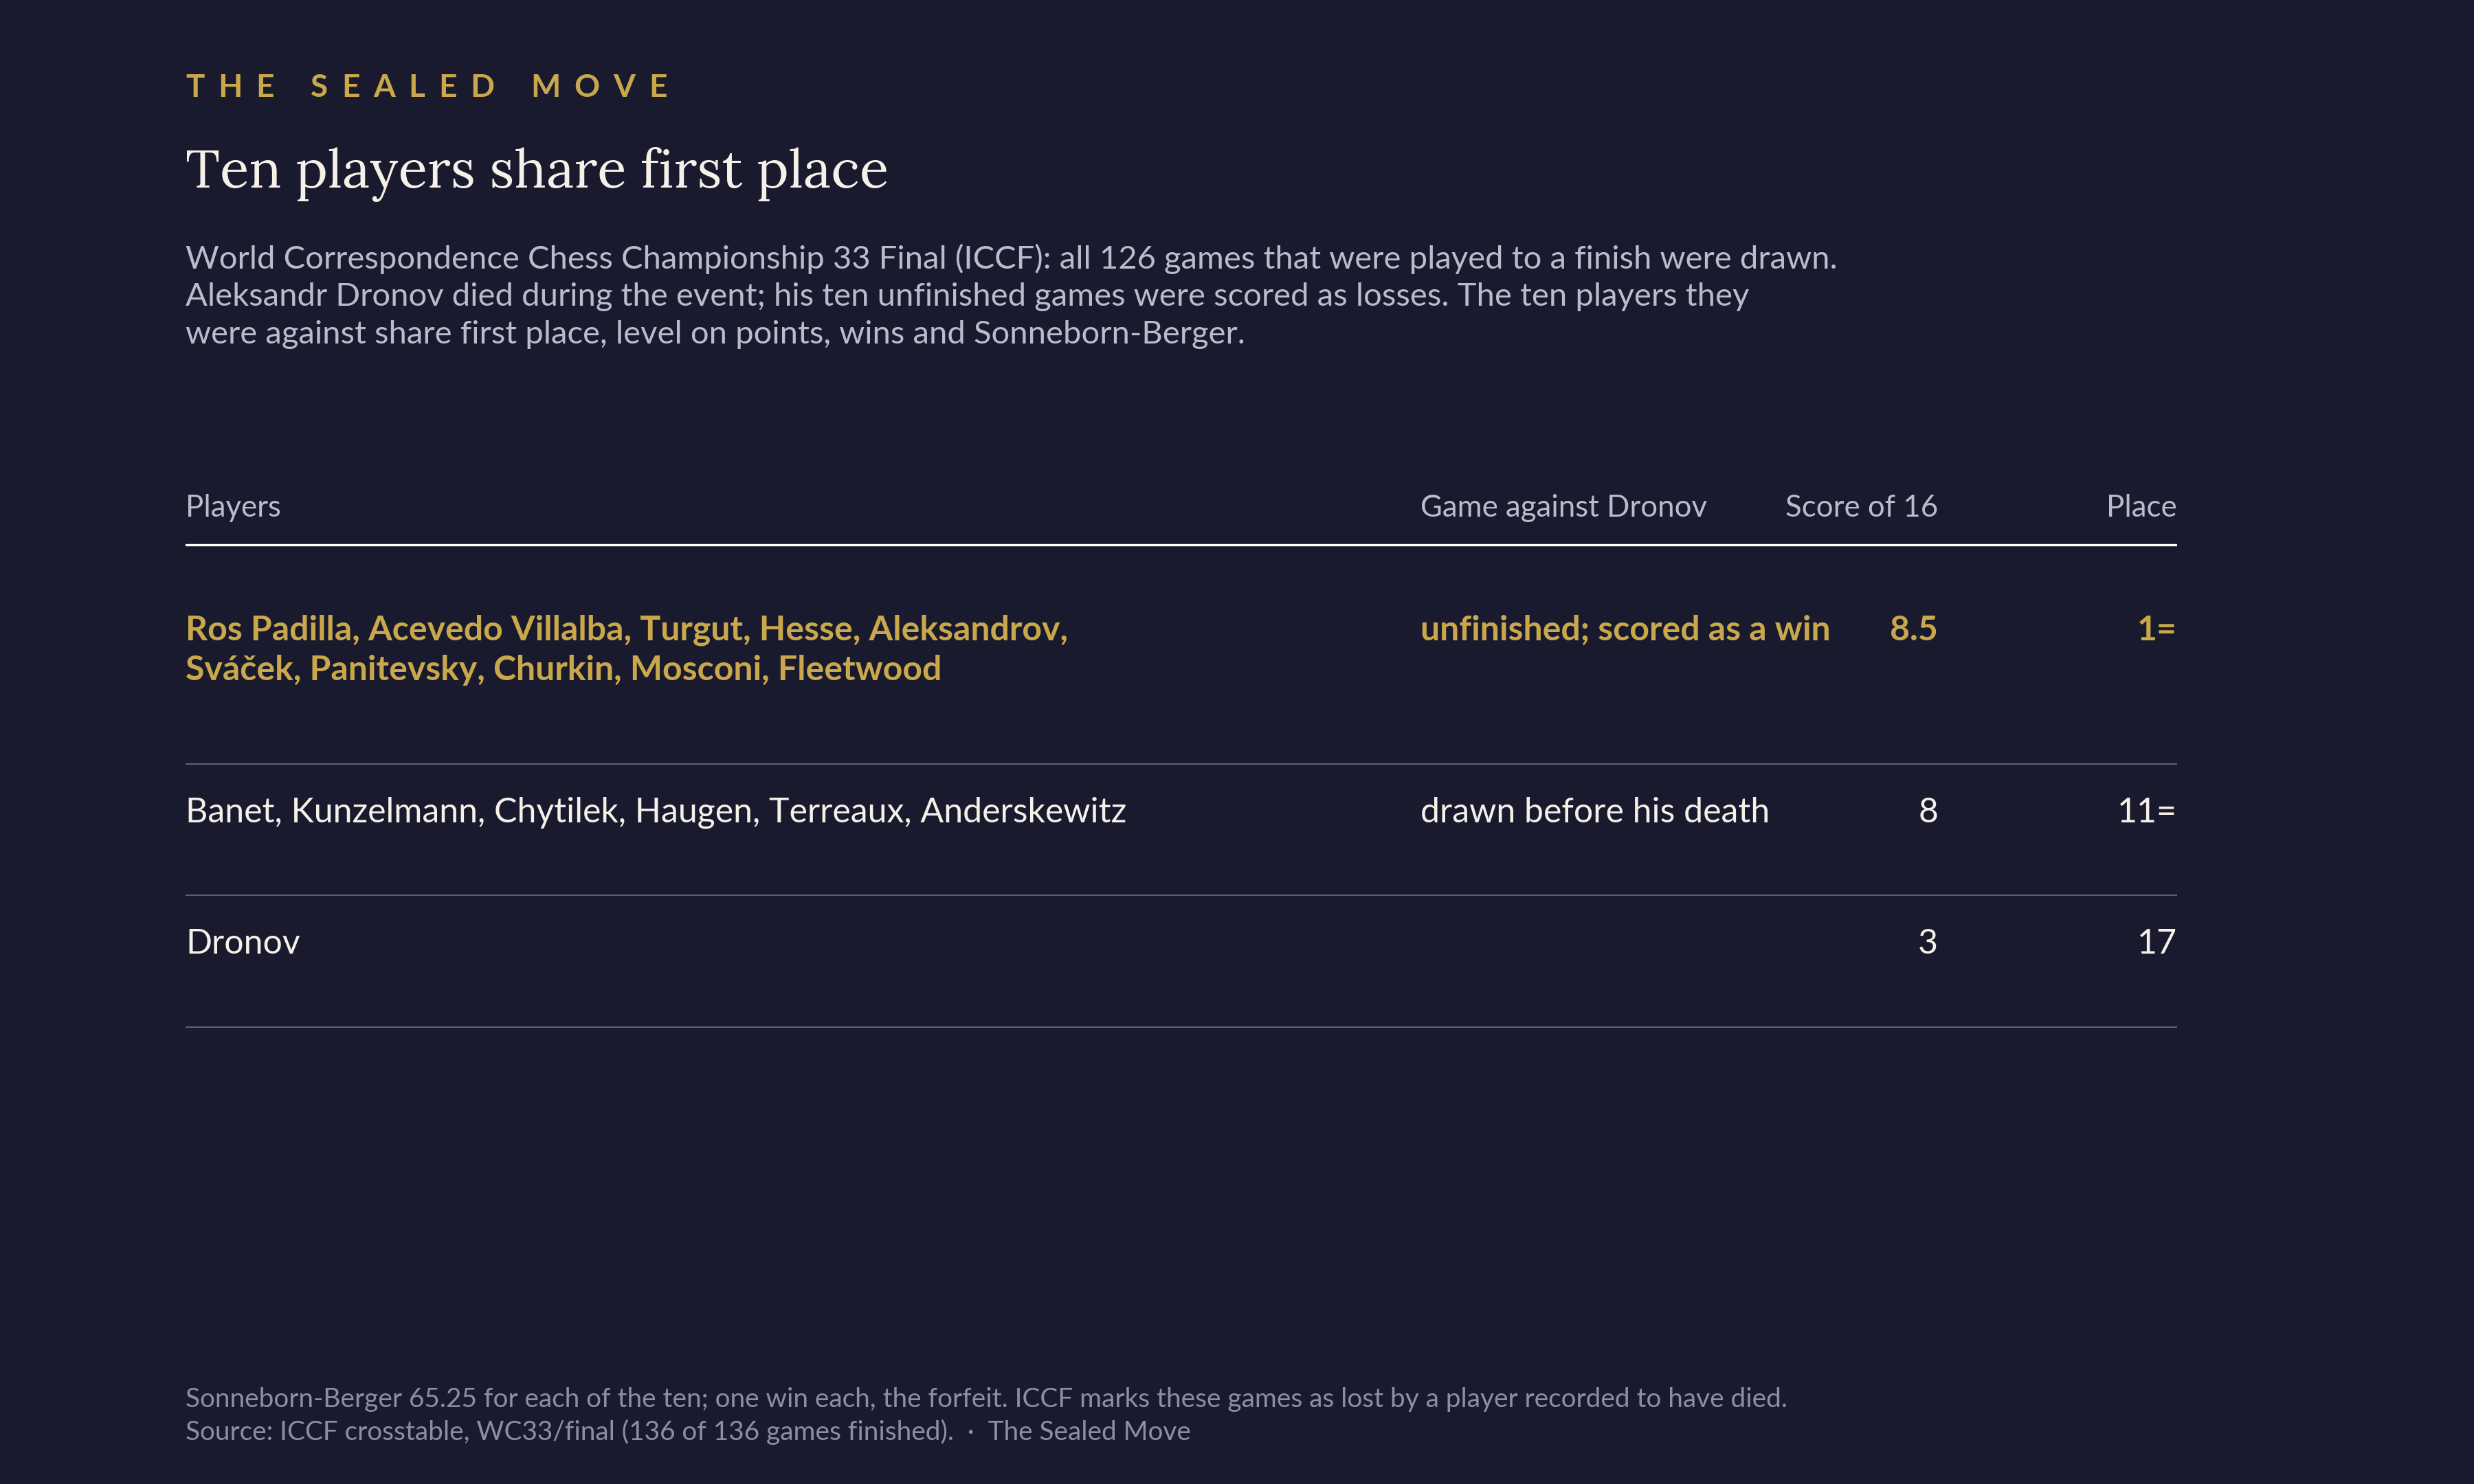
These same types of human errors feature in our top ICCF events. The most recent World Championship 33 Final resulted in all but 10 games being draws. The 10 “decisive” games were administrative wins due to the death of one of the competitors as summarised in Figure 16.
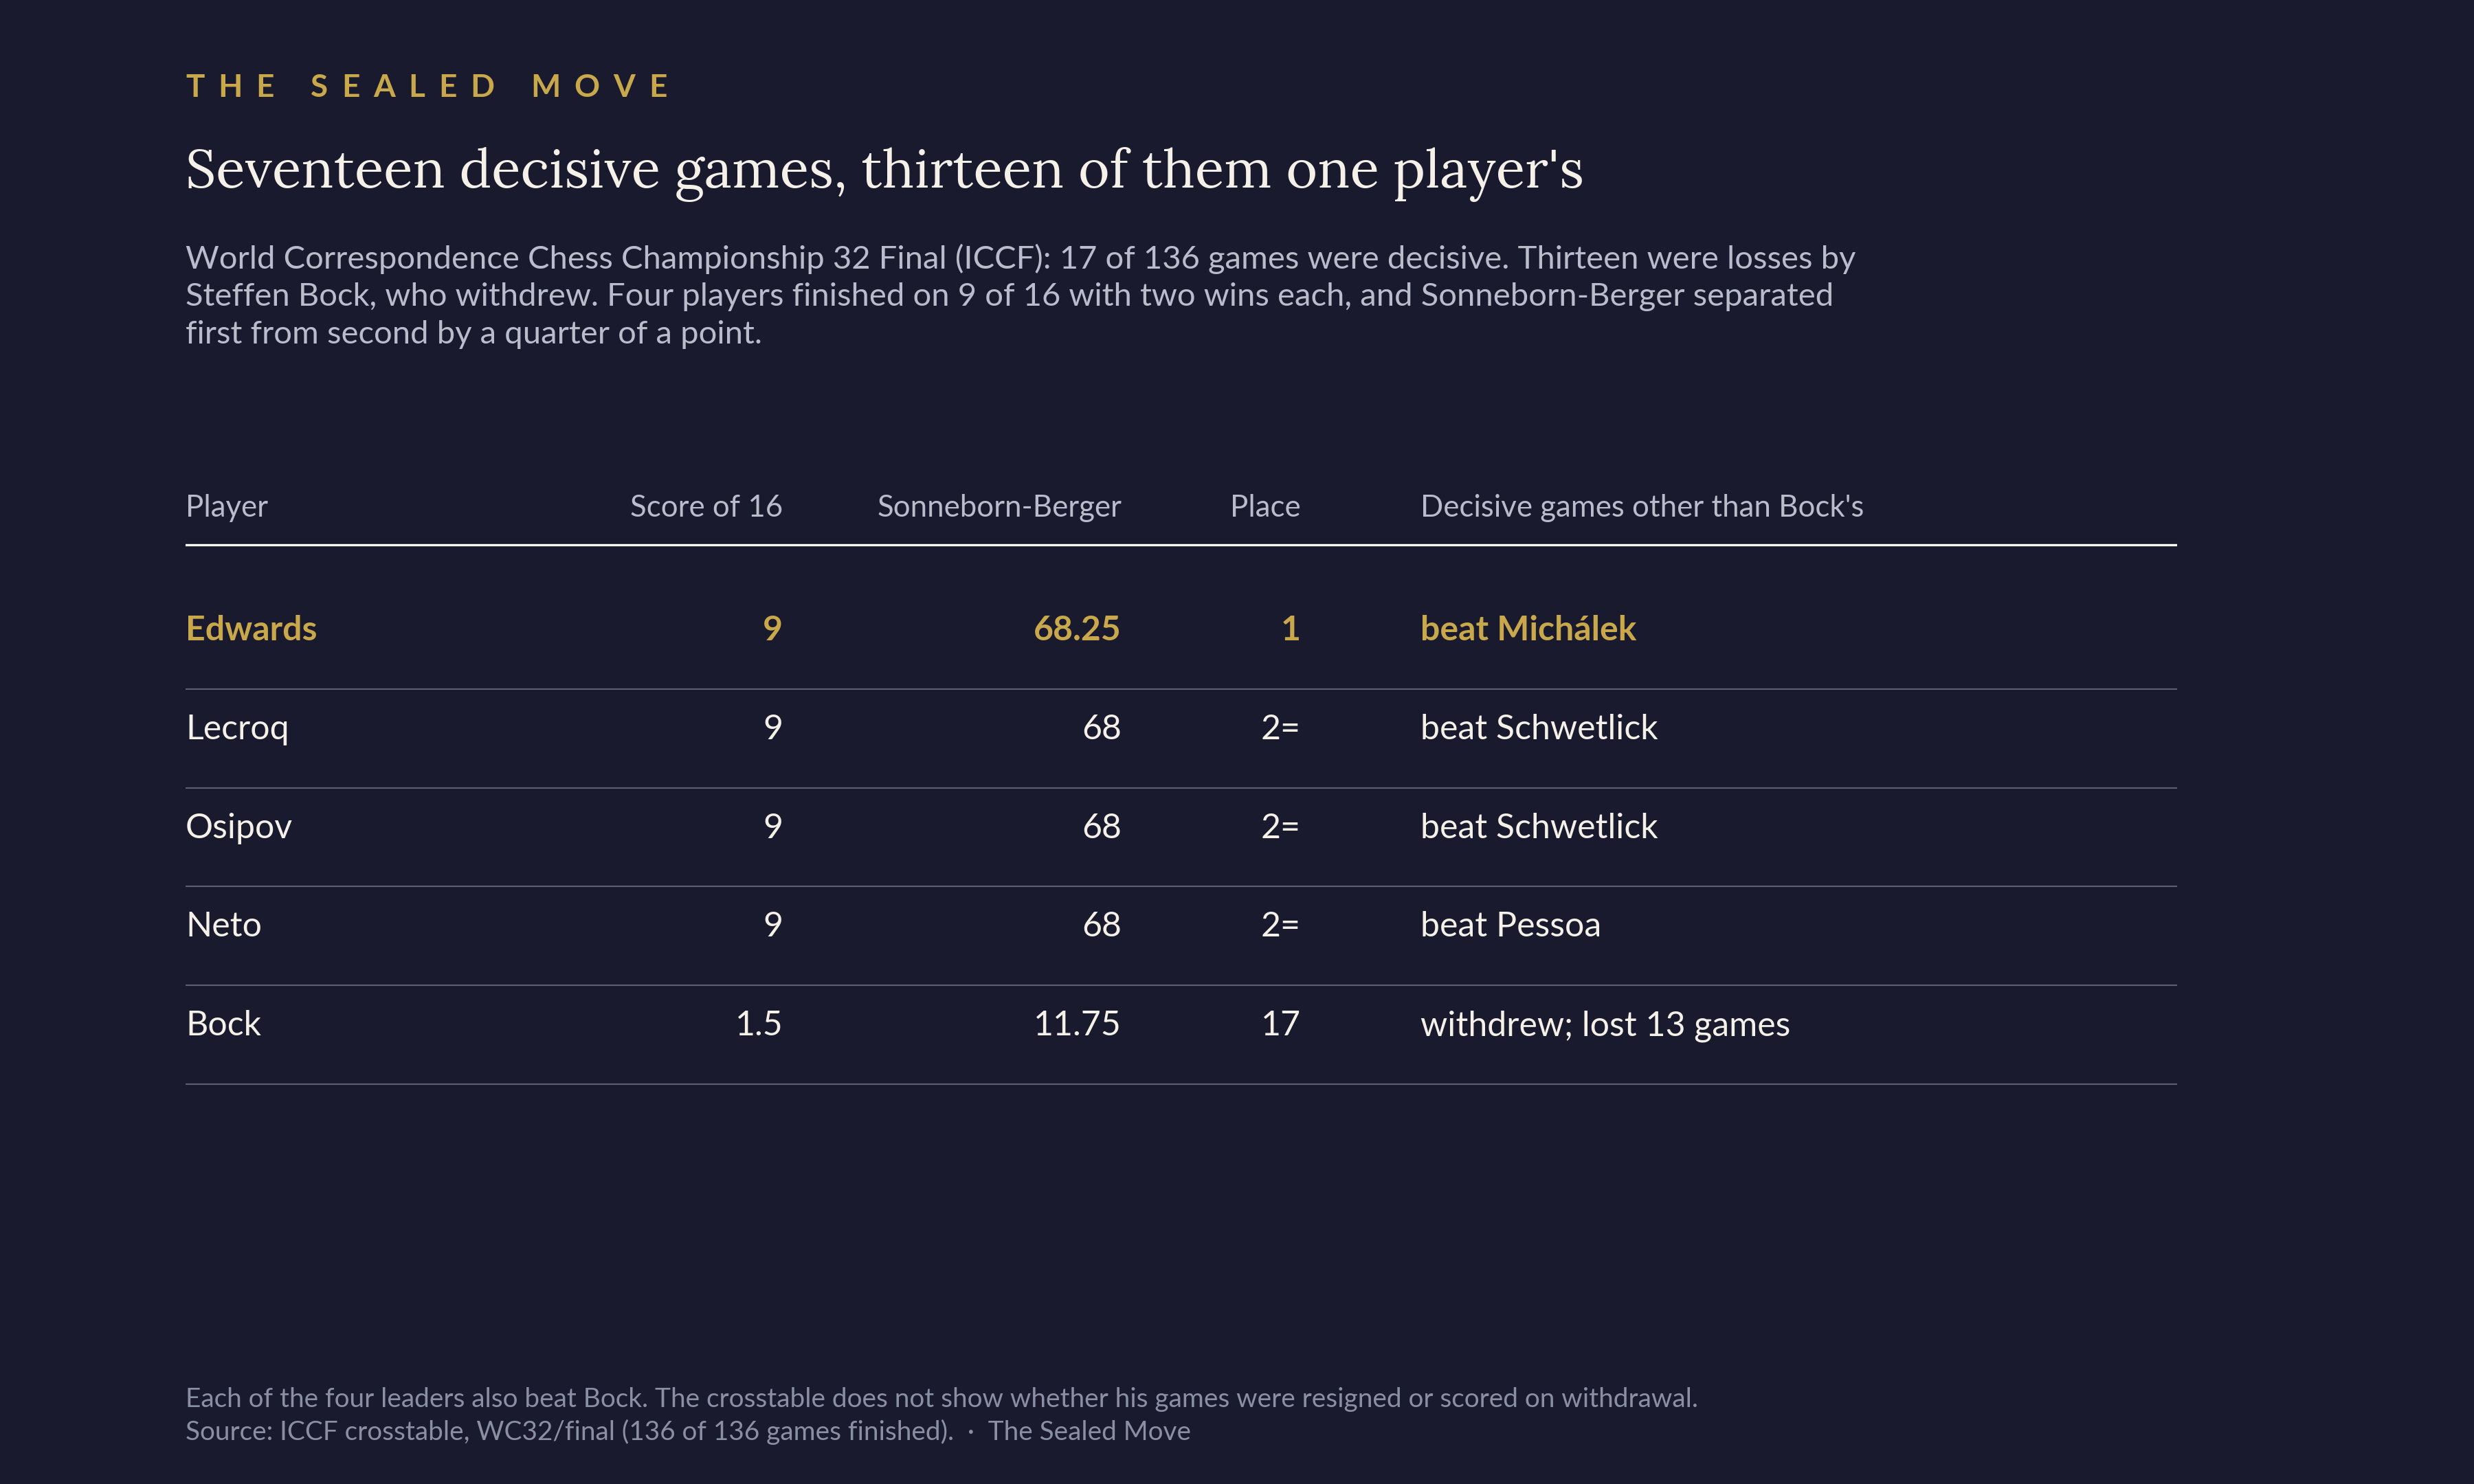
In WC 32, 17 of 136 games were decisive (12.5%) as shown in Figure 17. Of the 17 decisive games: 13 were administrative terminations; one was decided by resignation in an equal position, two were decided by one-move blunders, and one was a more gradual conversion of an advantage built on the board. The 13 administrative terminations were the games of a single player, SIM Bock, scored as losses when he withdrew. Another game involved an equal (0.00) position that was resigned by another player (Pessoa-Neto 0-1), as shown in Figure 18.
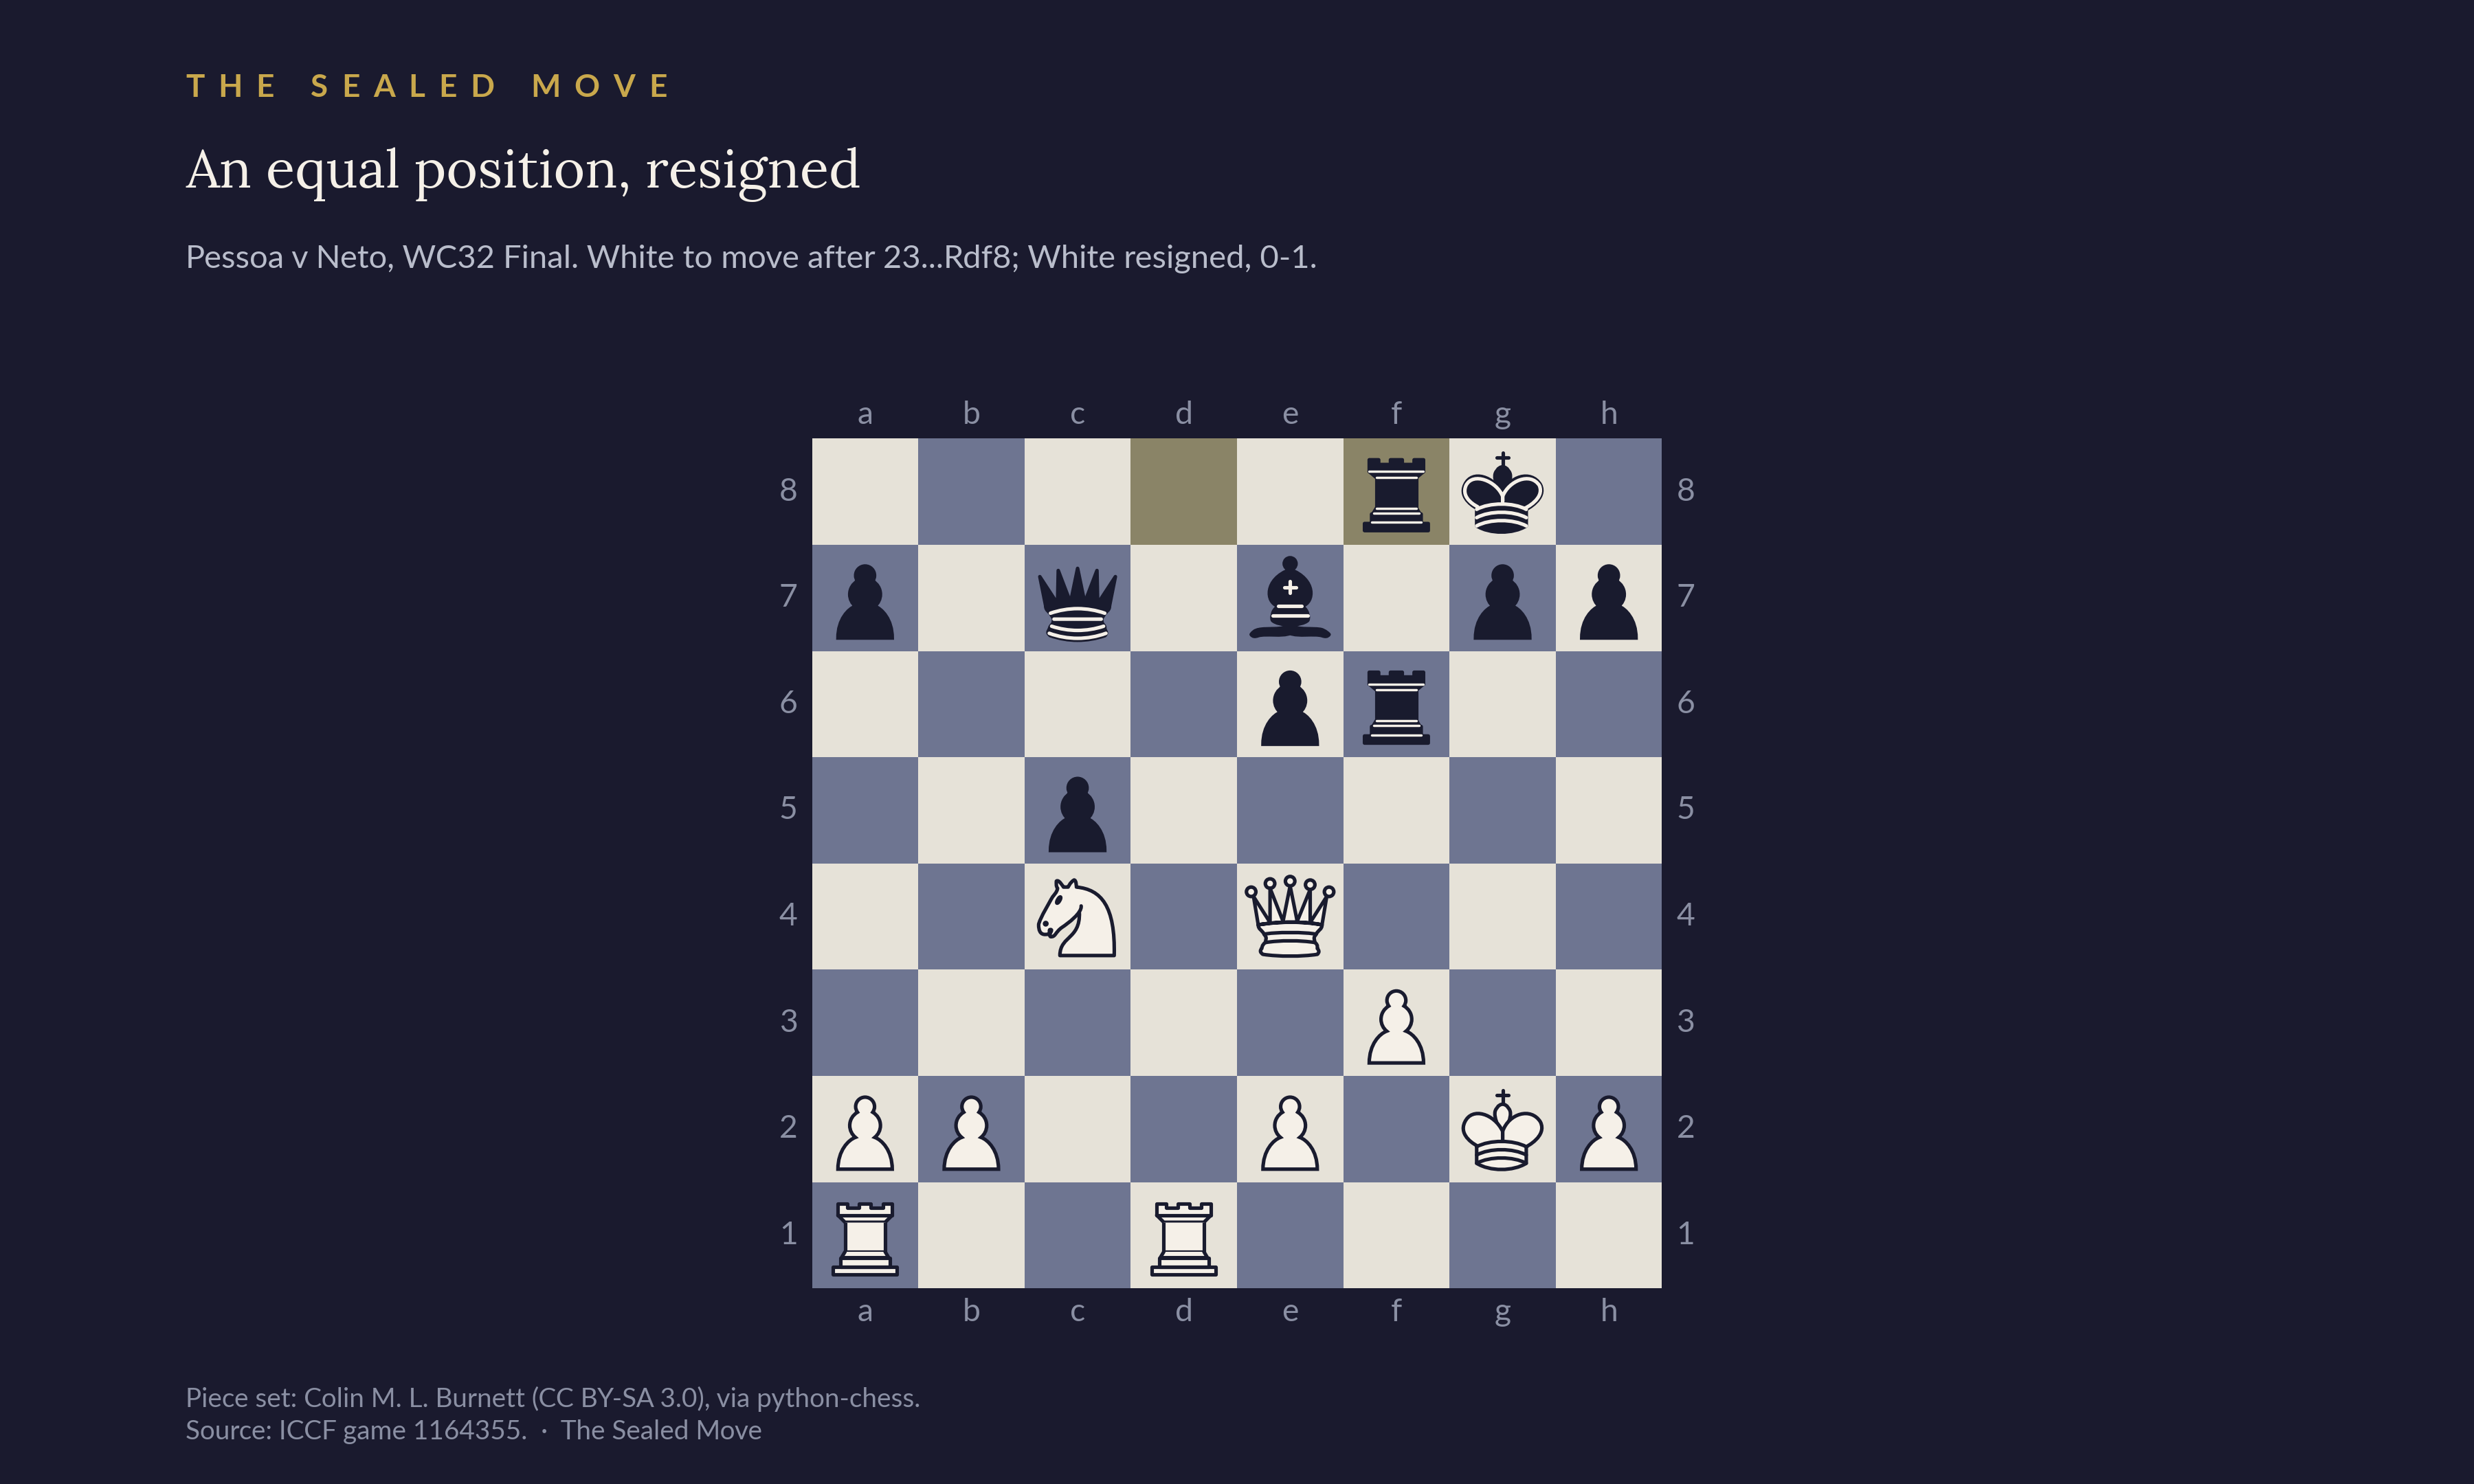
Game: https://www.iccf.com/game?id=1164355
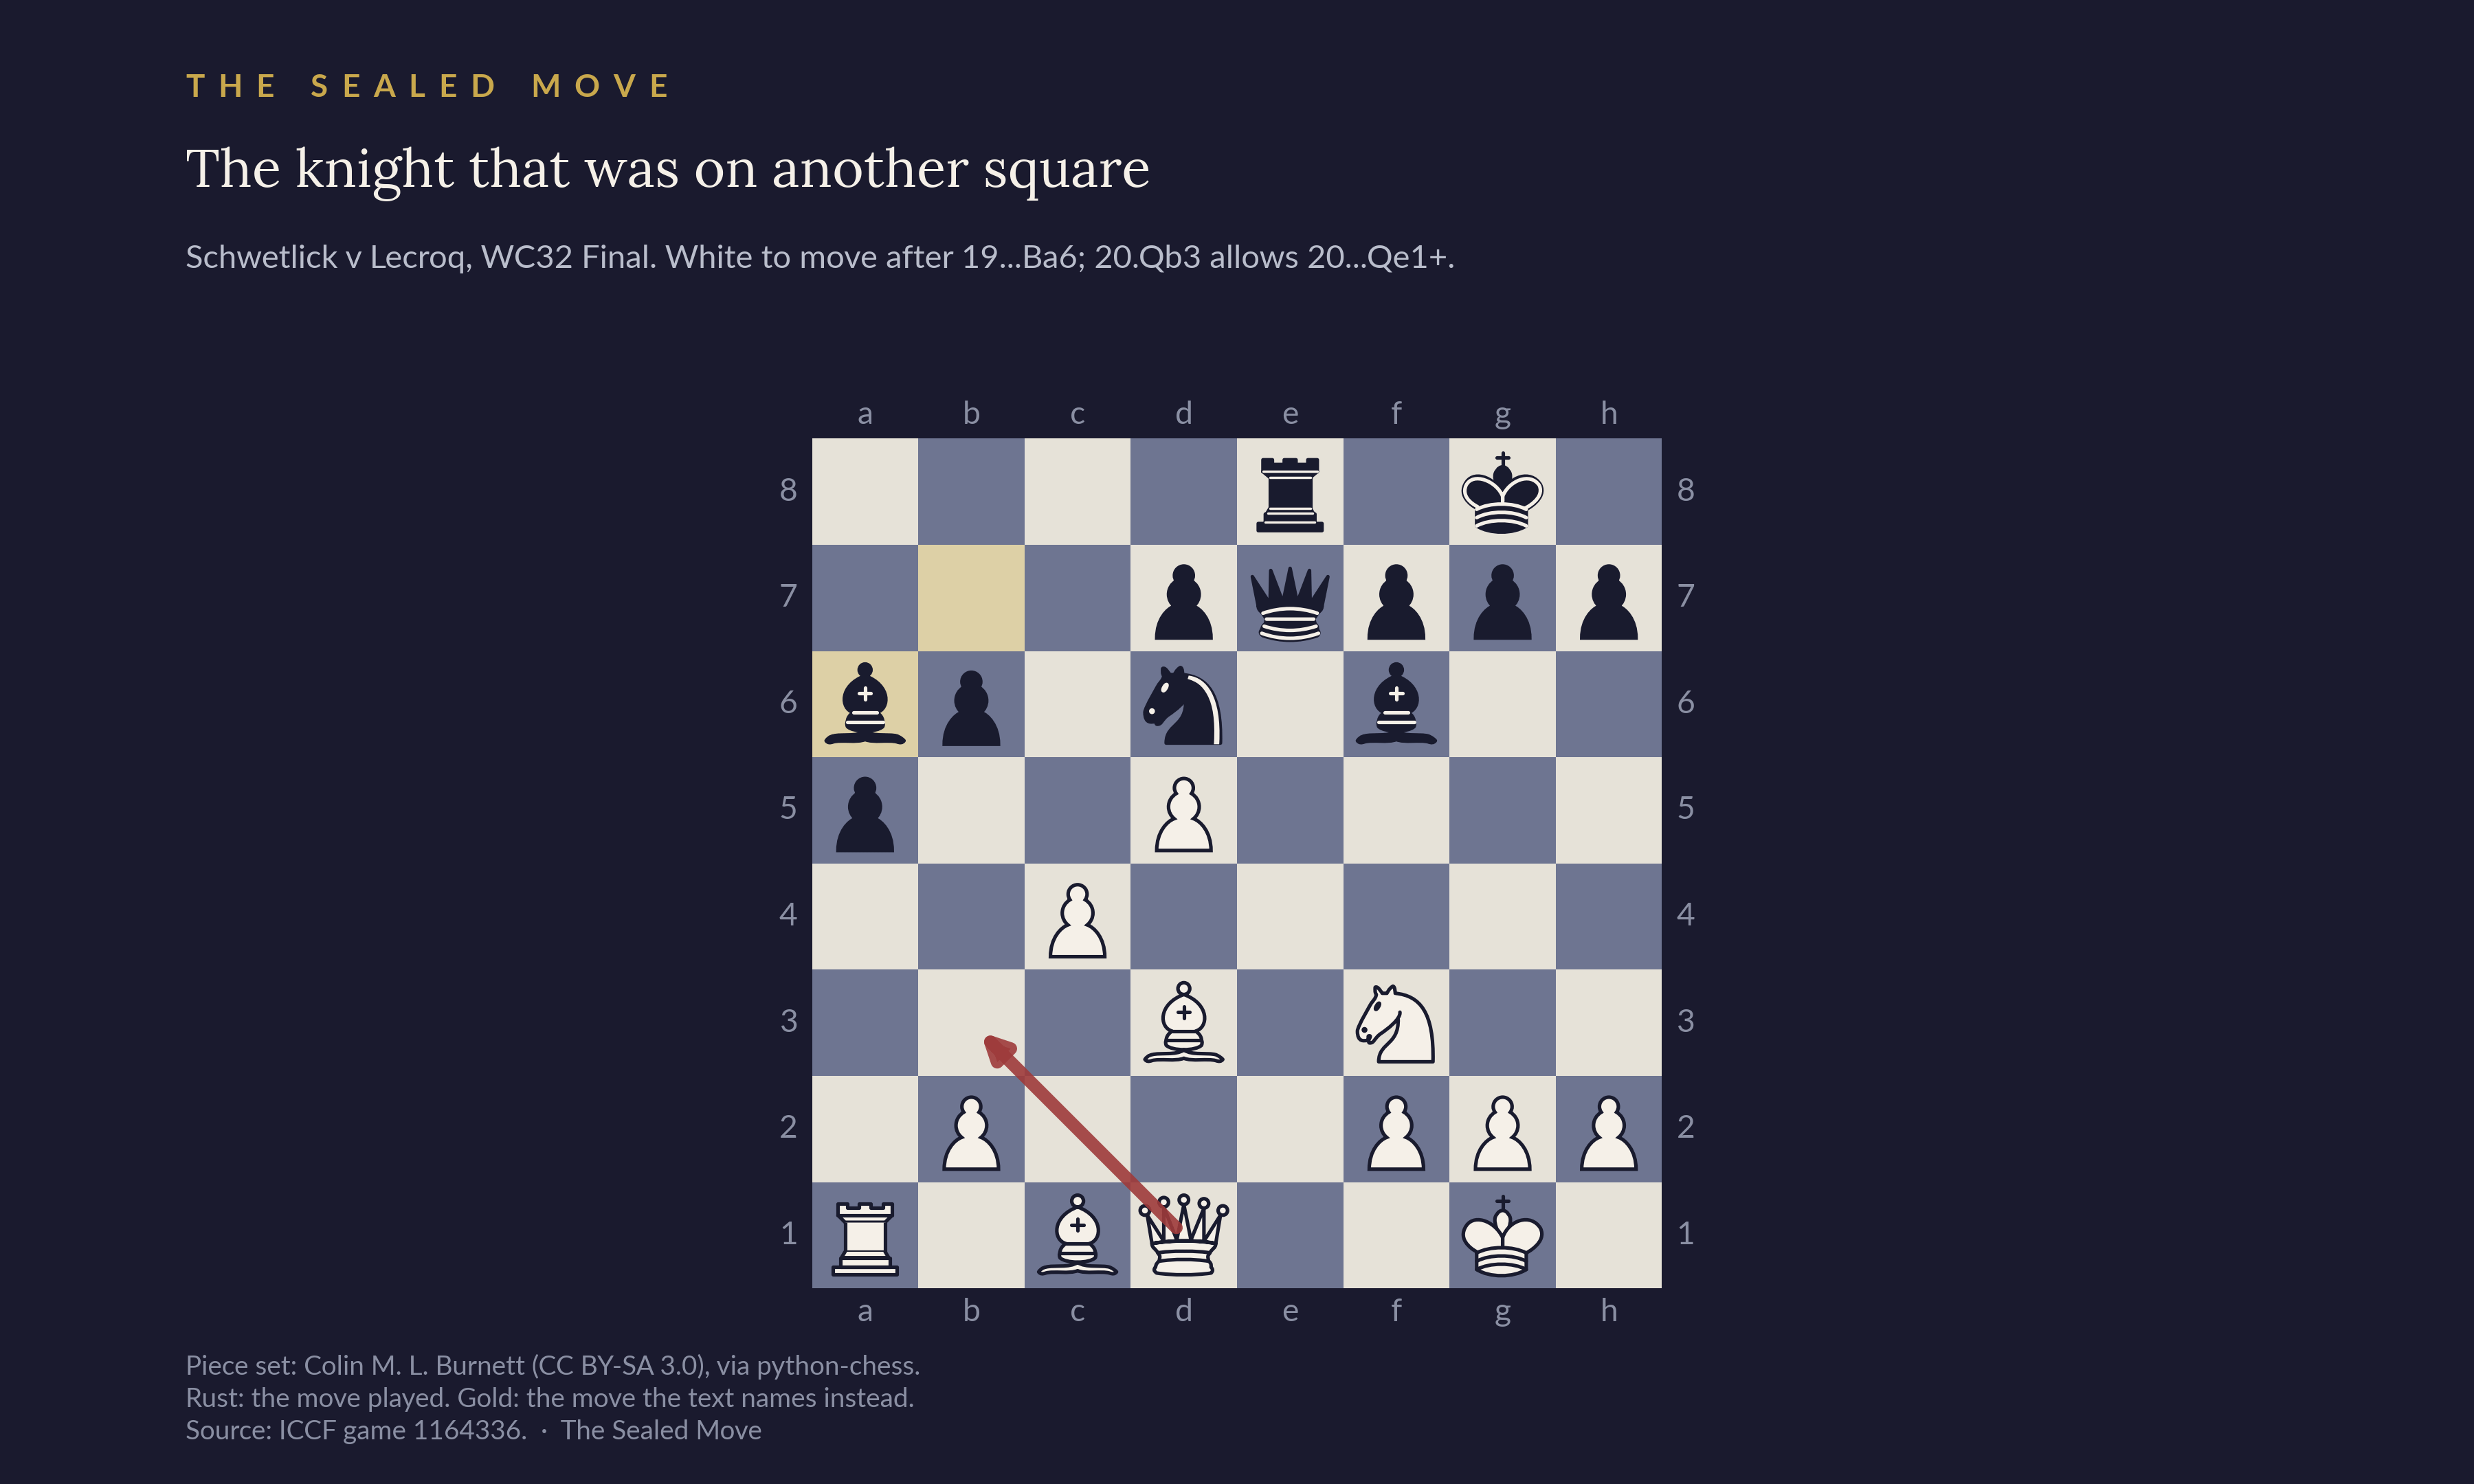
The two blunders were human errors comparable to the scenarios discussed earlier in Section 6. In Schwetlick–Lecroq, 20. Qb3?? was played in an otherwise balanced position (see Figure 19). The move 20.Qb3 took the queen off d1, the last guard of the back rank. That let Black play 20...Qe1+, and after 21.Nxe1 Rxe1+ 22.Bf1, the bishop on f1 is pinned to the king. Black then picks up c4 with an overwhelming position. The swing was from equal to about minus 8 in one move according to Stockfish 19. Lecroq explained the cause on the French AJEC forum. His opponent believed his knight was on f1, not f3. In other words, Schwetlick was analysing a different position from the one on the server. The knight had come to f3 on move 19, but Nf1 is considered just as good by the chess engine (Stockfish 19) which offers Nf3, Qc2, and Nf1 as the top candidates, all at 0.00. It appears this was a combination of two of the blunder mechanisms previously discussed back-to-back. At move 19 they fell victim to “right piece, wrong square.” It is worth noting that once again this involved a knight. Then they subsequently failed to sufficiently validate the position on their analysis board relative to the position on the server when they entered the move. Just as had been the case in the earlier examples, had 19. Nf1 been played then 20. Qb3 would be a reasonable response to Ba6. Instead, it loses on the spot with the knight on f3.
Game: https://www.iccf.com/game?id=1164336
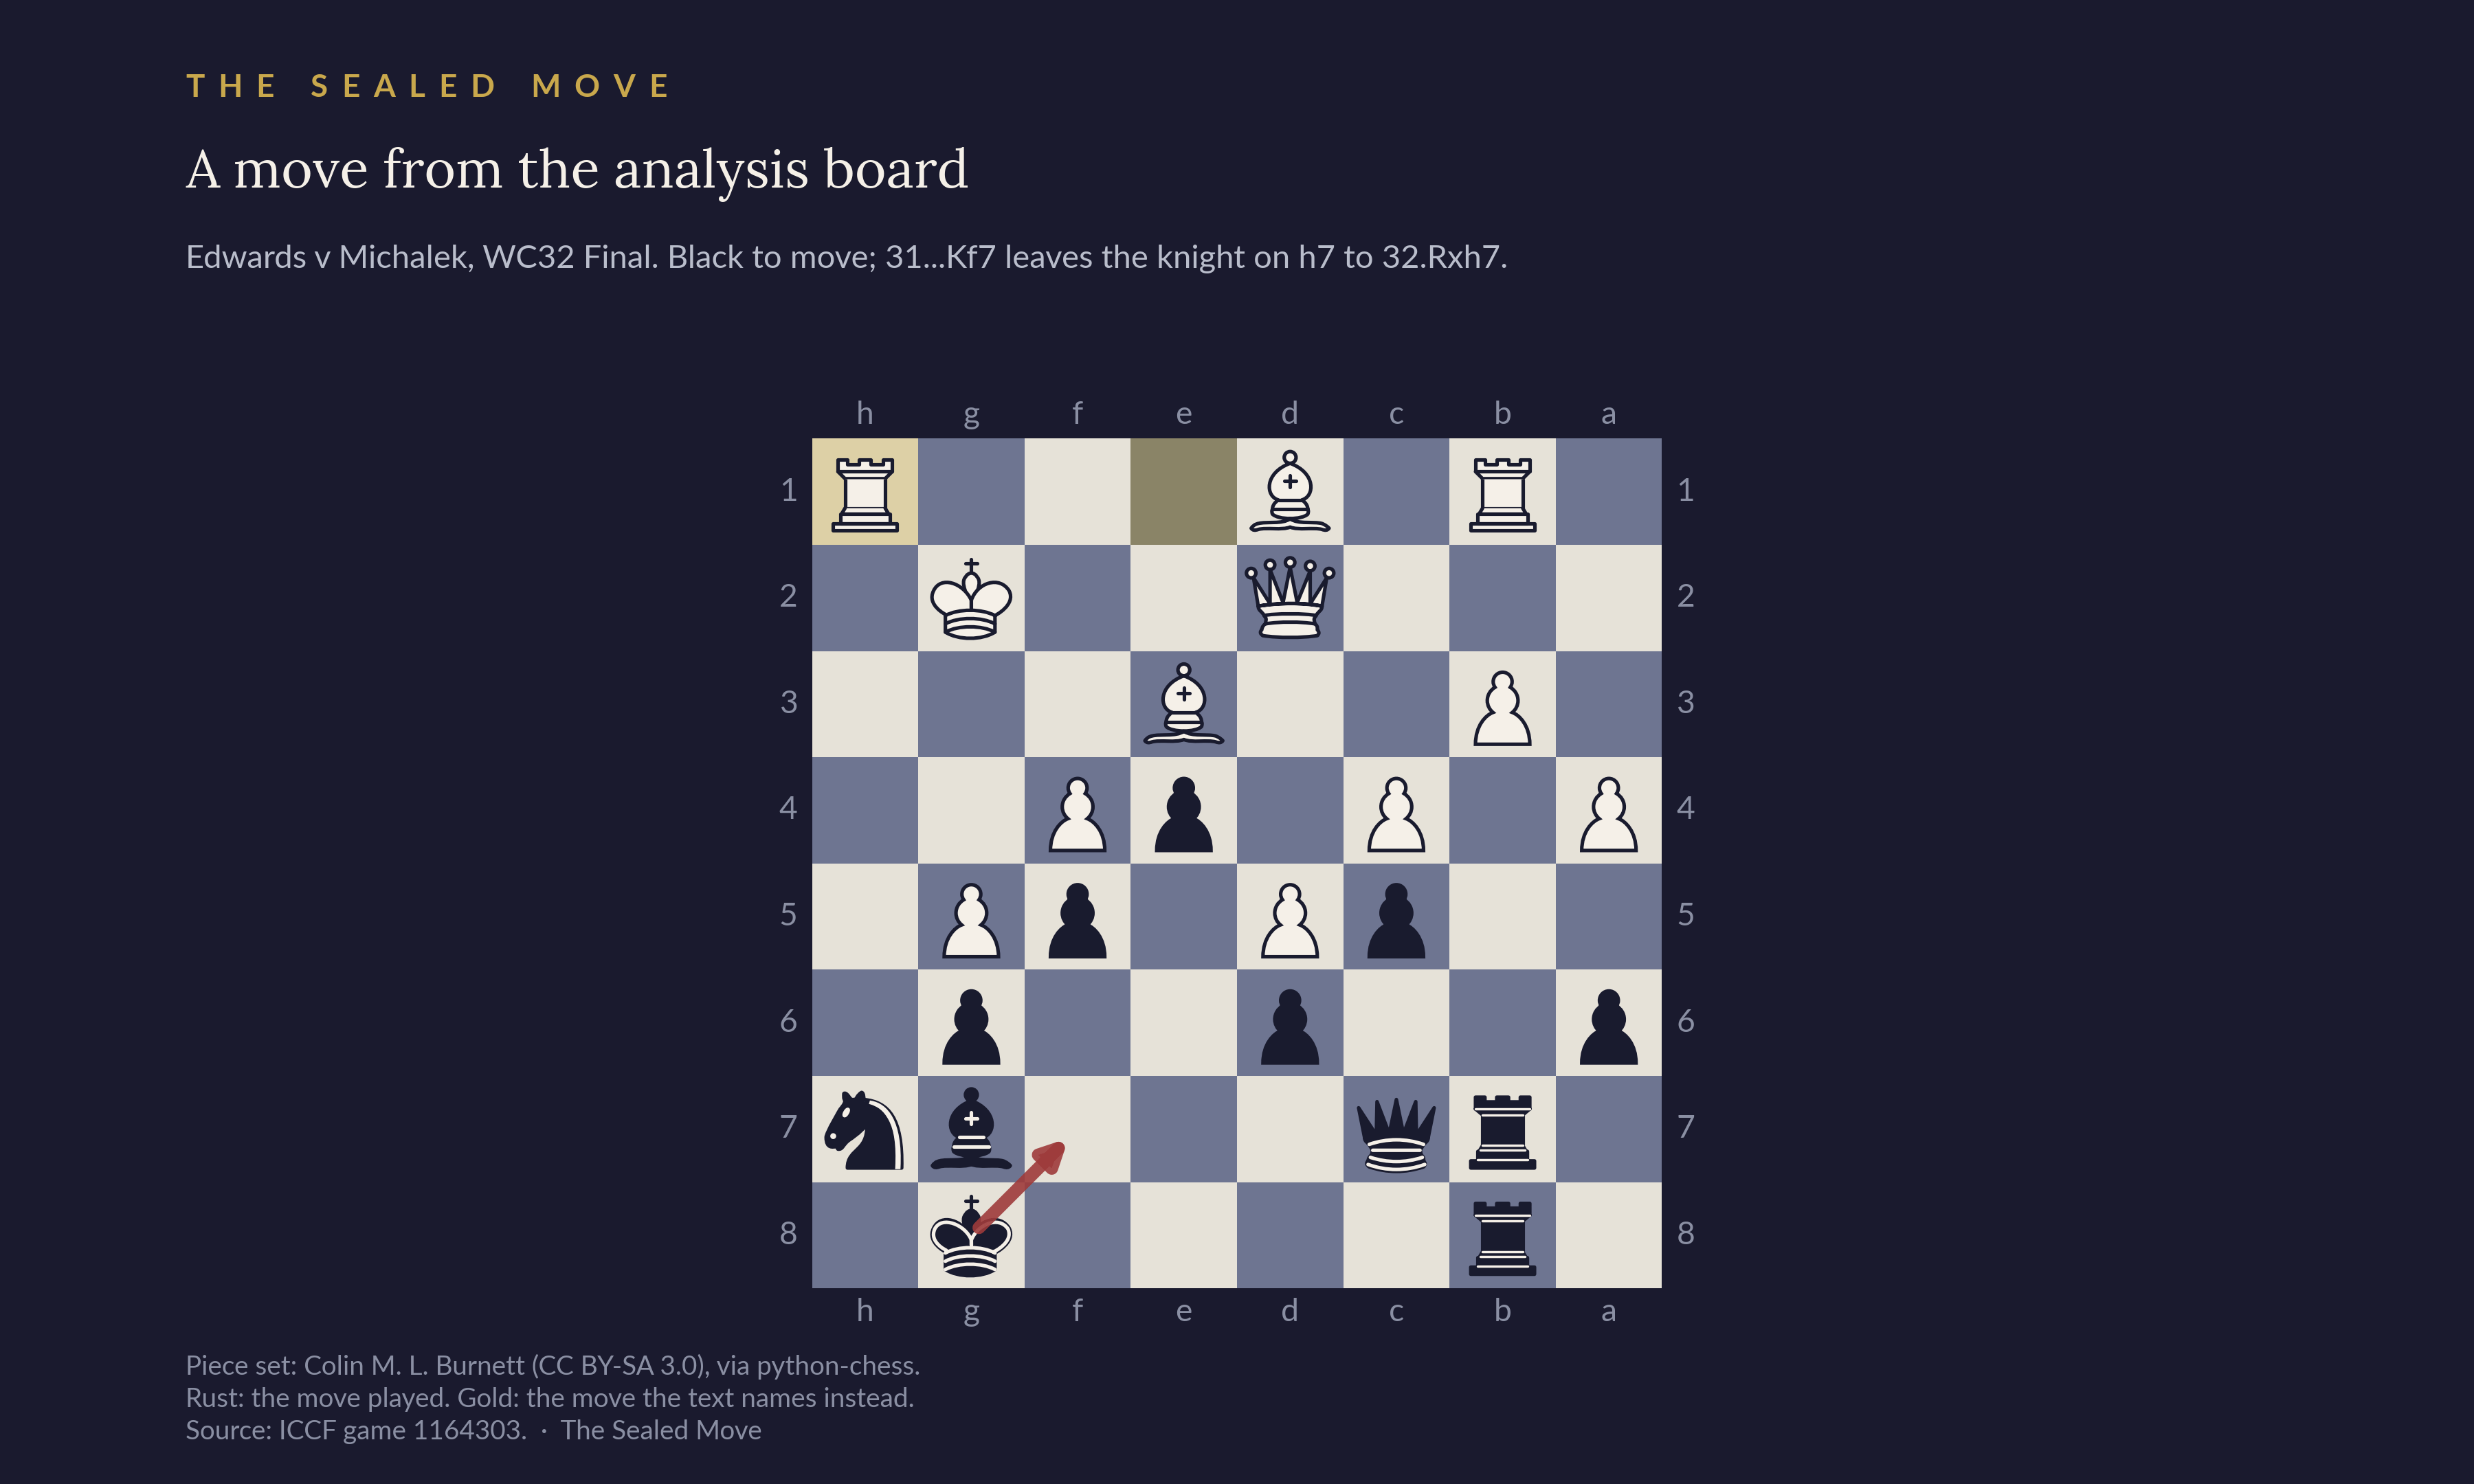
In Edwards-Michálek, the players have pointed it out as a case of incorrect move input, instantly hanging a piece and losing the game. GM Edwards refers to this in his paper in the ICGA Journal where he wrote “my win in the WF32 involved a +2 result and considerable fortune. One win, for example, came as the result of a clerical error.” The move 31...Kf7?? is a game-losing blunder (Figure 20). After 31...Nf8 or virtually any move other than the move that was played Black has zero losing chances. To understand what may have happened, note that the alternative 31. Rf1 Kf7 is fine for Black and 31. Rf1 is one of several 0.00 moves for White at move 31. It is possible that Black had 31. Rf1 on their analysis board and entered the move for the wrong position into the server. Black may also have been analysing a top engine line such as 31. Bc2 Nf8 32. Rh1 Kf7, in which the knight has already left h7. It is also possible that this was a case of Michálek “getting ahead of himself” and inputting Kf7 because on his analysis board he was looking at move 32 rather than move 31. We see these same human error patterns in ICCF play at all levels.
Game: https://www.iccf.com/game?id=1164303
In the most recent Olympiad 22 Final, two games are still ongoing as of 26 October 2026. Of 466 finished games, 458 were draws and 8 (1.7%) were decisive. Of these eight decisive games, one was administrative (time forfeit after a blunder), three appeared to have been one-move blunders due to human error, and four were conversions. We summarise these decisive games in Figure 21.
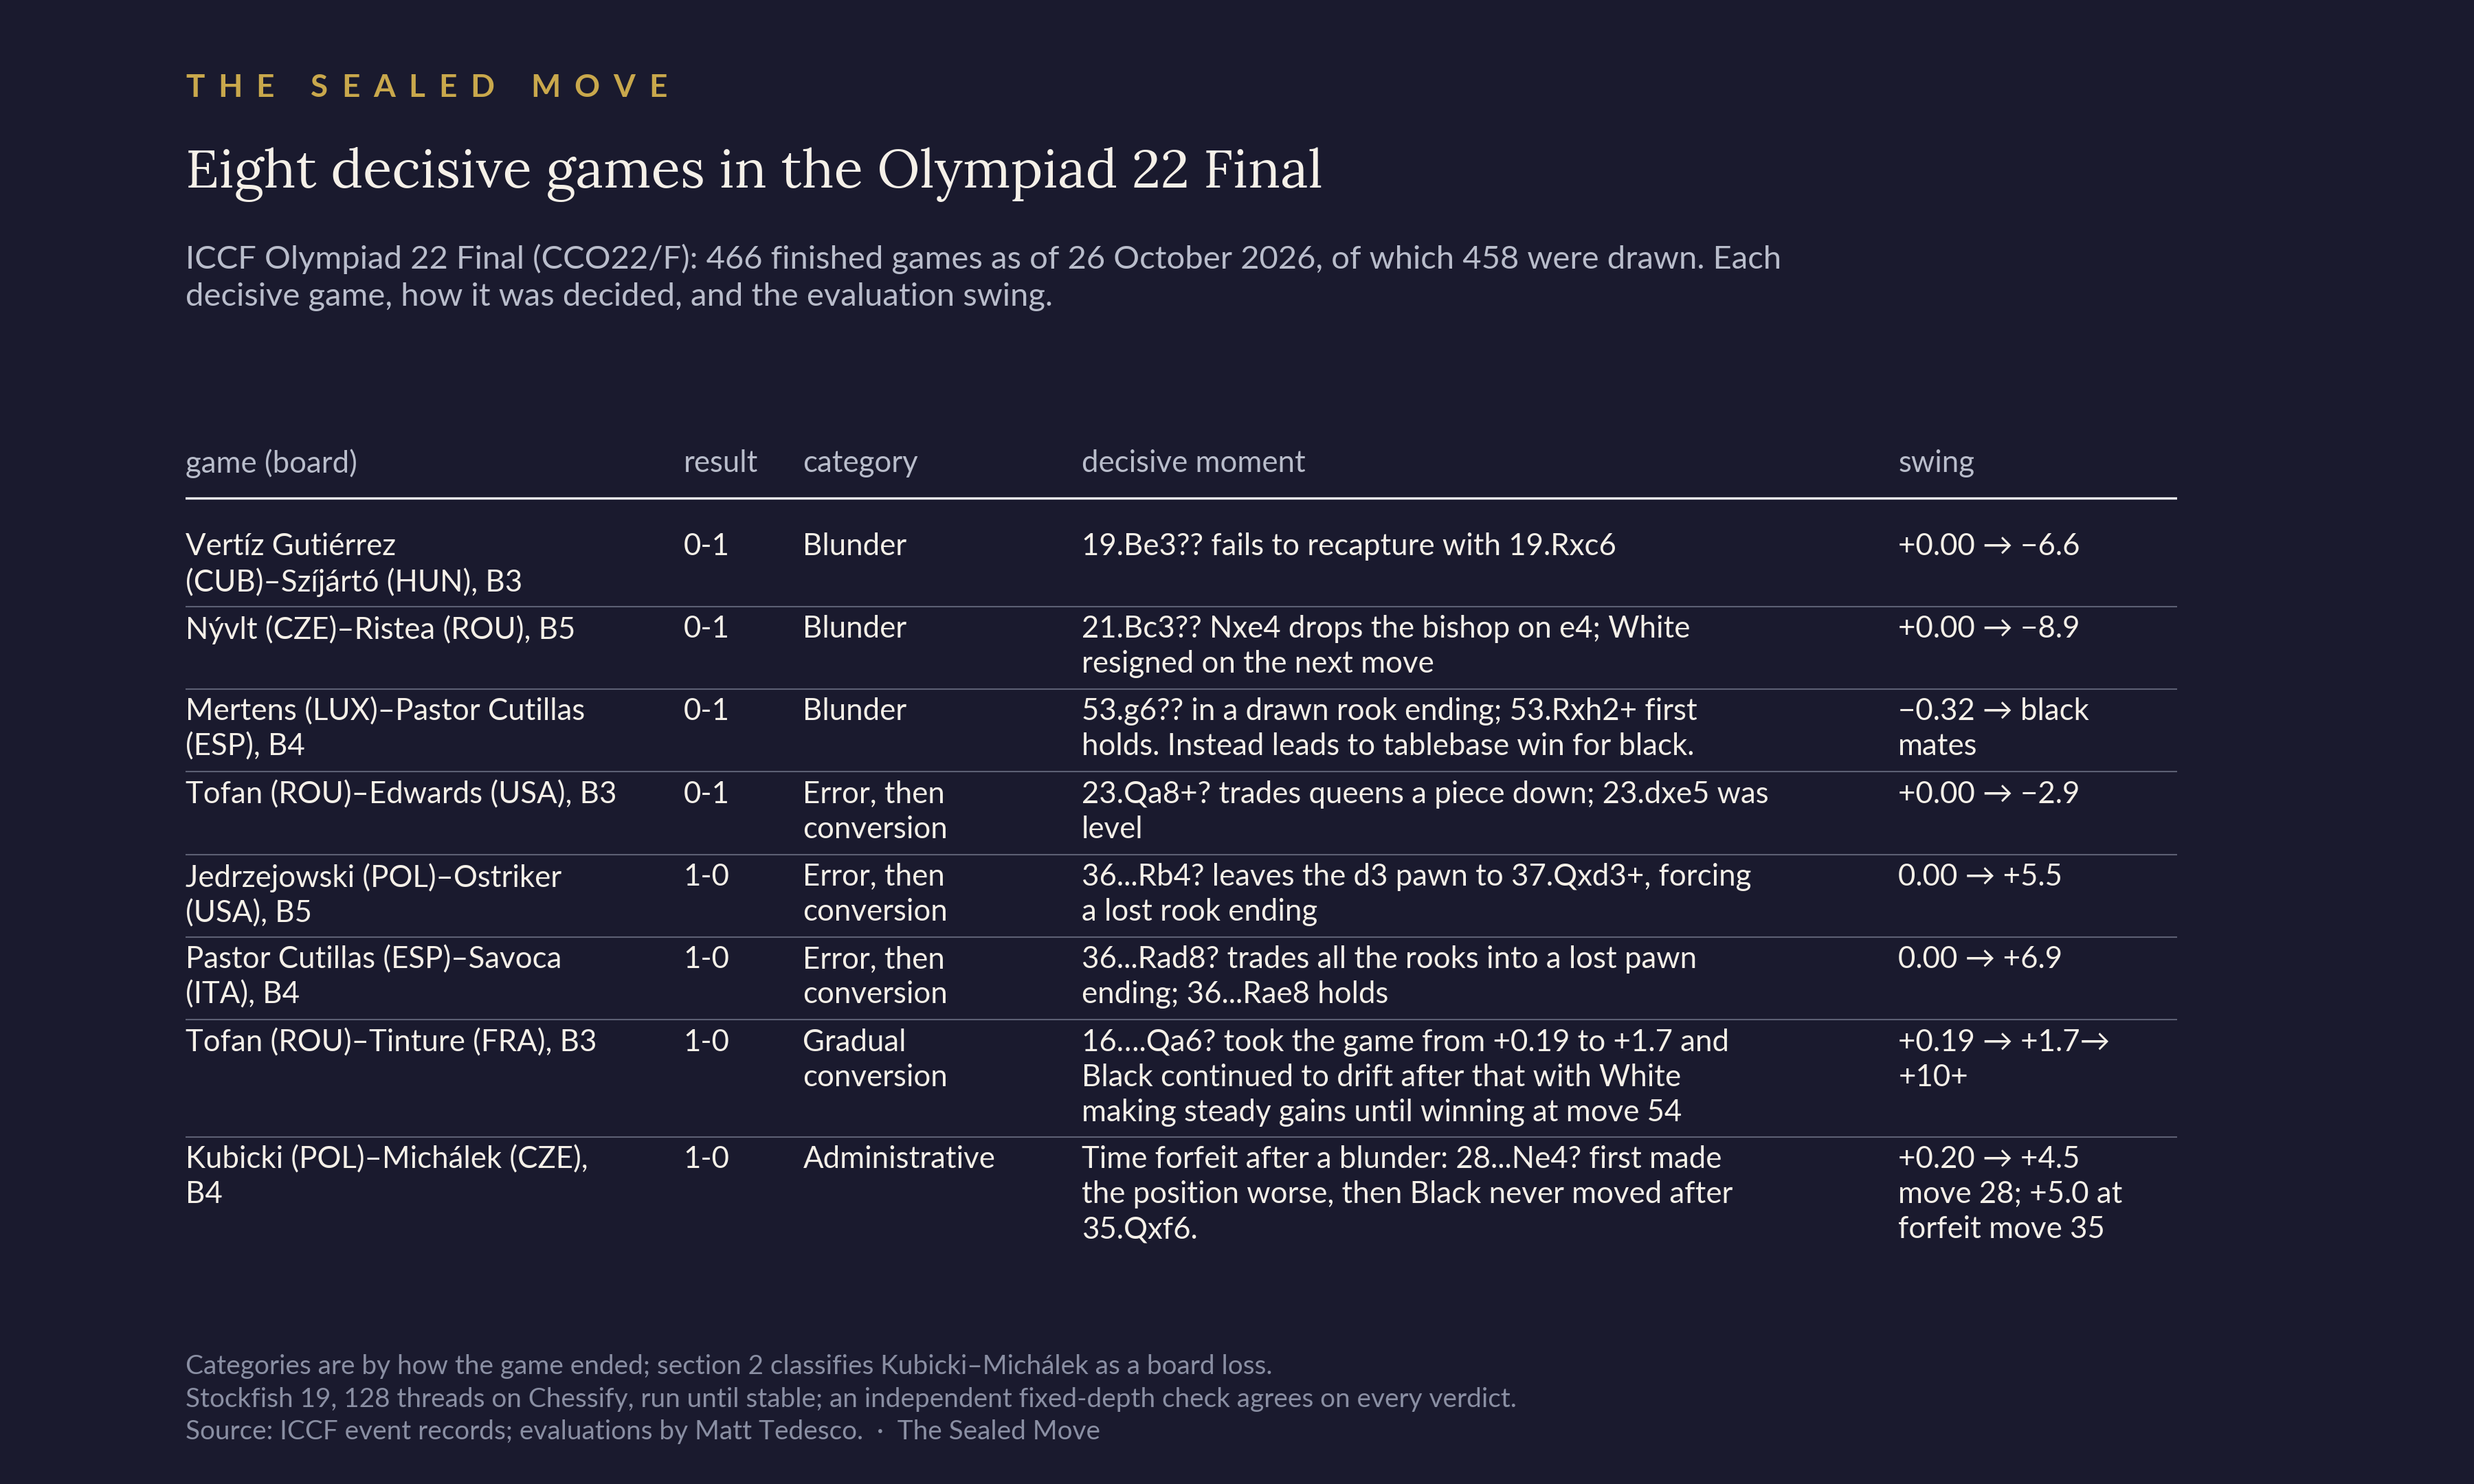
Games: Vertíz Gutiérrez (CUB)–Szíjártó (HUN); Nývlt (CZE)–Ristea (ROU); Mertens (LUX)–Pastor Cutillas (ESP); Tofan (ROU)–Edwards (USA); Jedrzejowski (POL)–Ostriker (USA); Pastor Cutillas (ESP)–Savoca (ITA); Tofan (ROU)–Tinture (FRA); Kubicki (POL)–Michálek (CZE).
Evaluations in the table and in this section: Stockfish 19, 128 threads on Chessify, each position run until the evaluation stabilised, with forward and backward propagation through the analysis tree. An independent check (Stockfish 19, fixed depth 40) agrees on every verdict, and wherever the two differ by more than half a pawn, both have one side more than two pawns ahead. Note that the categories here are by how the game ended; Section 2 classifies by the final position, under which Kubicki–Michálek counts as a board loss.
In one of the blunders, Pedro Vertíz Gutiérrez played 19.Be3 (Figure 22) repeating an ICCF human error pattern of “getting ahead of themselves.” The engine’s main line here is 19.Rxc6 Bxe5 20.Be3, so Be3 is White’s correct second move of the top line. It looks like the move from deeper in the analysis was entered in the server instead of the first one. It is the same type of failure as Schwetlick’s 20.Qb3 in WC32 when the position on the server didn’t match the one being analysed.
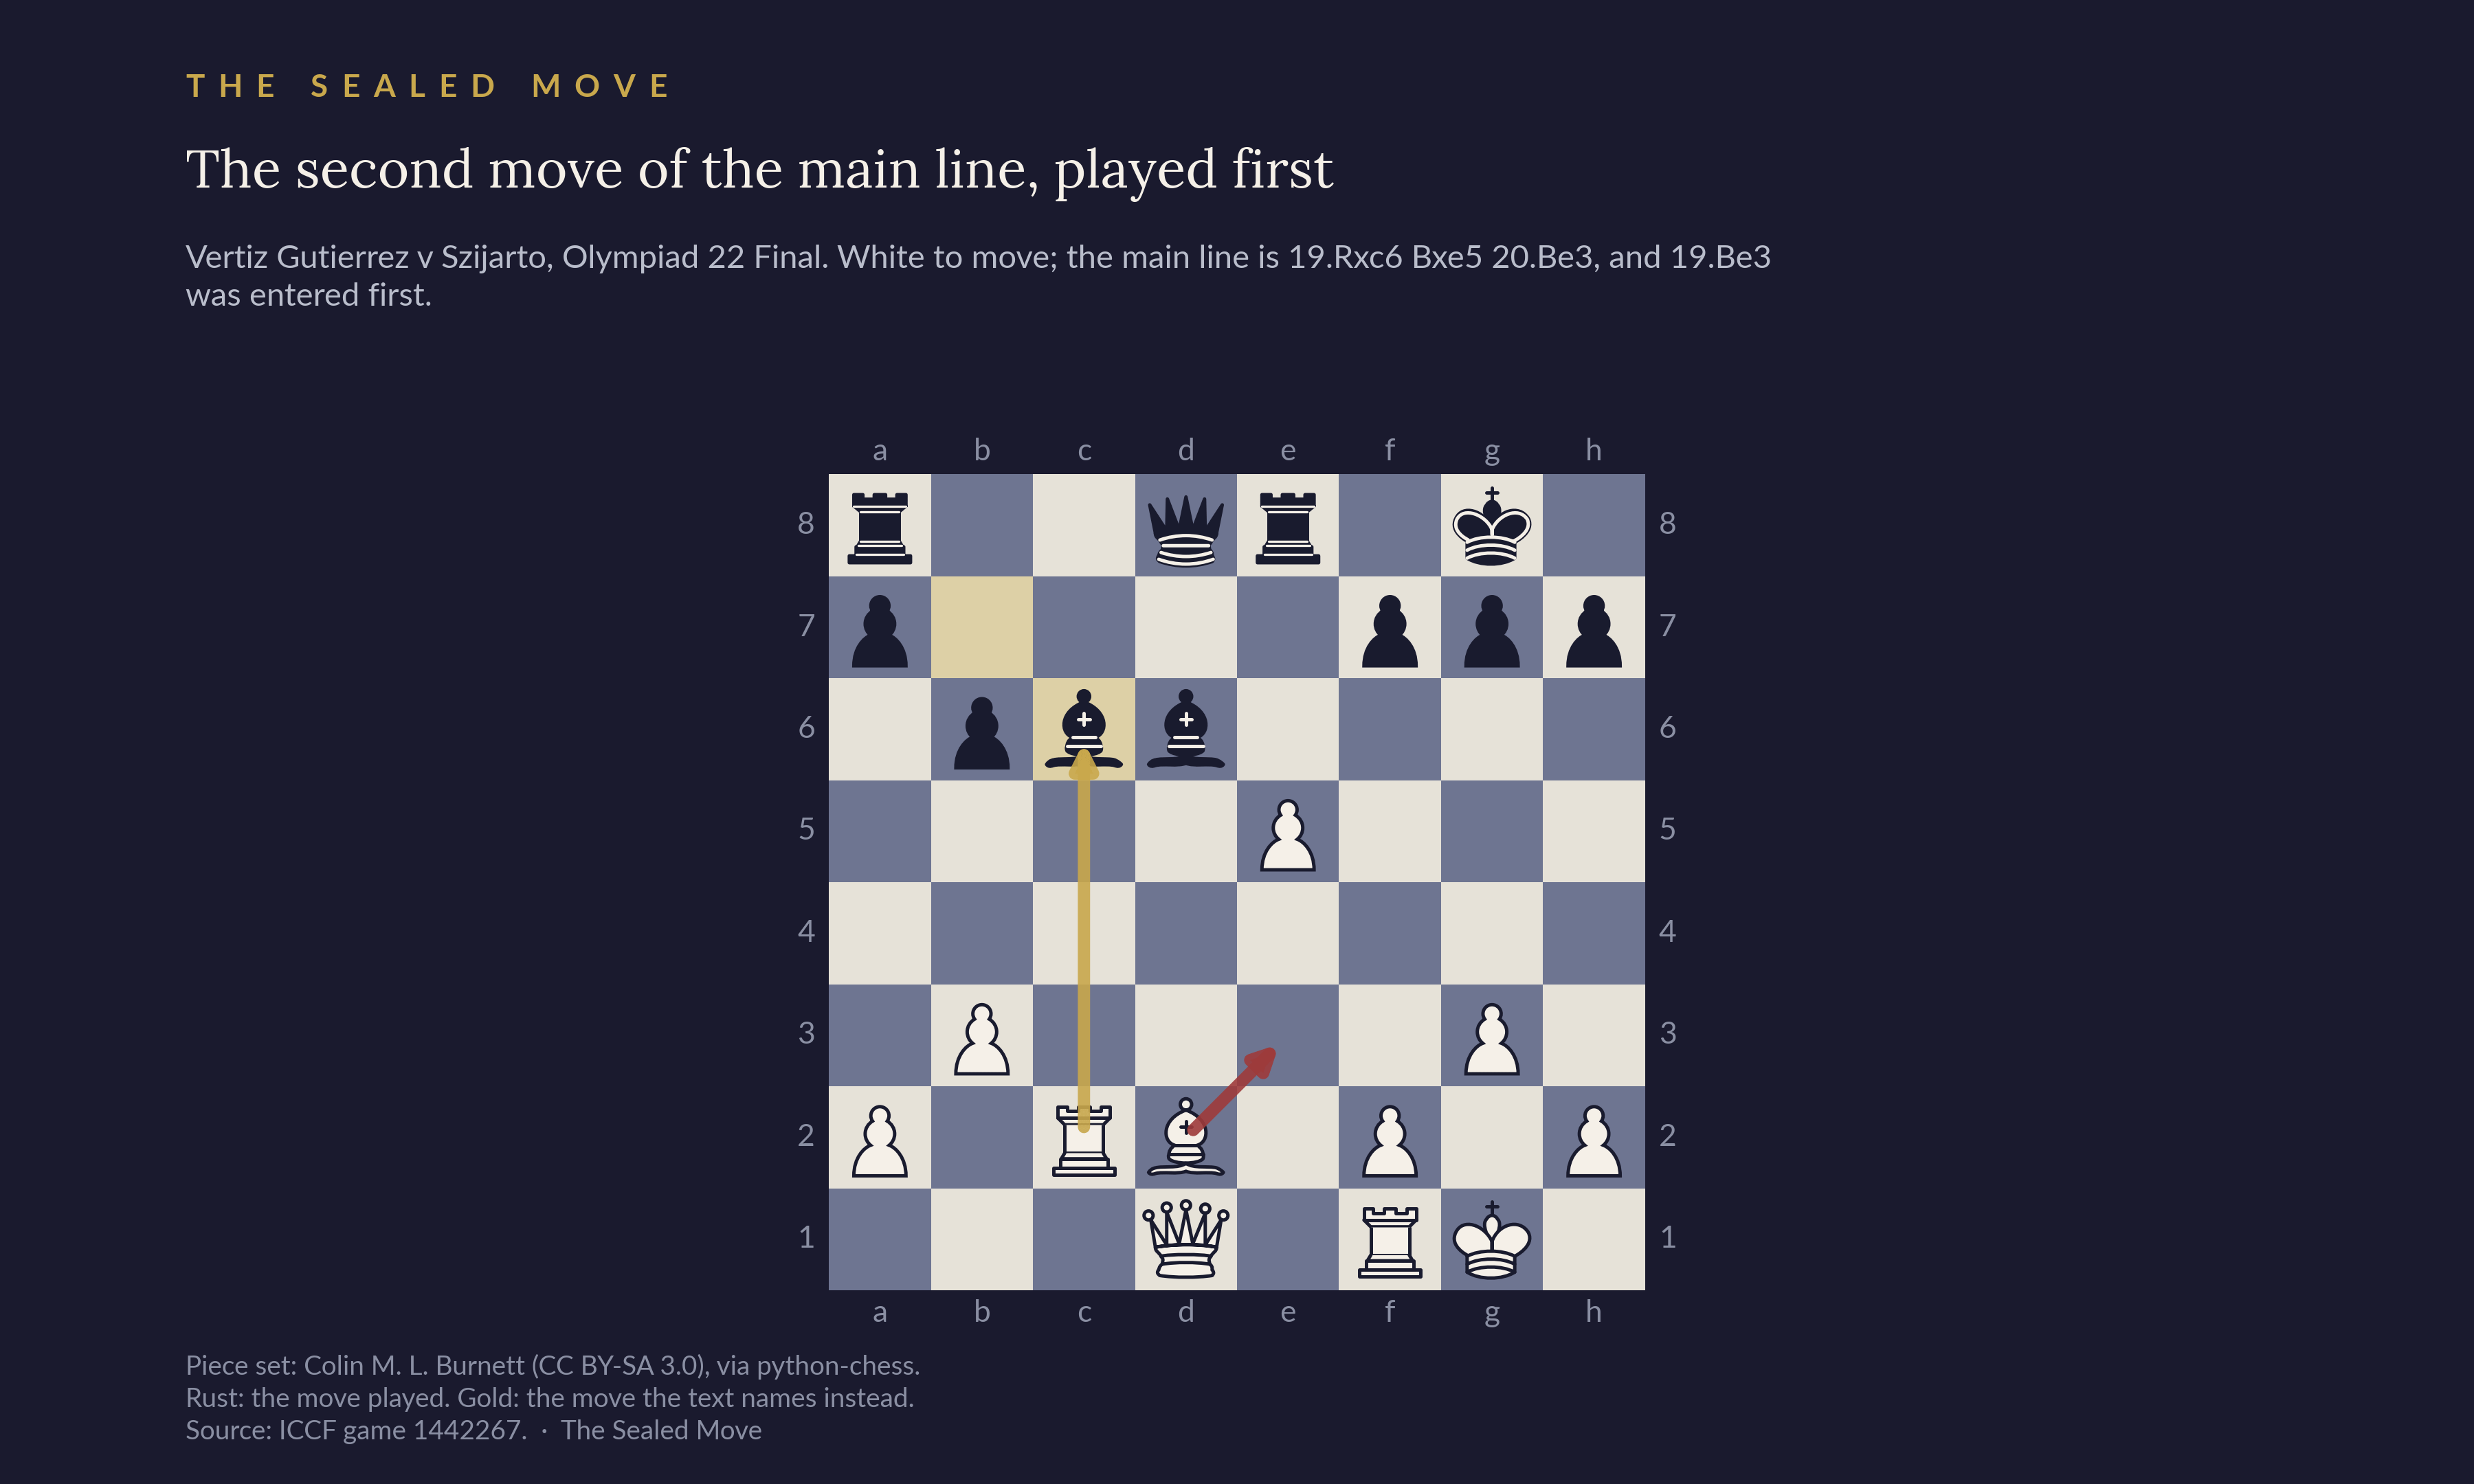
Game: https://www.iccf.com/game?id=1442267
Close — what are the implications for ICCF play?
What are the implications for ICCF play that only approximately 3% of games at top level are decisive with approximately 43% of those decisive games due to administrative terminations? Losses over the board, as opposed to administrative decisions, are down 89.5% over the last decade. Losses over the board fell by 12 to 23 per 1,000 games a year over 2012–2022, depending on band, with no floor in evidence. Our analysis supports the argument that the top of the game is a test of stamina and disciplined focus. The modern ICCF tournament favours those who can keep submitting moves without having some catastrophic event that results in an administrative decision (e.g., timeout or forfeit) and who are able to manage a substantive game load with continued precision without human error being introduced into their move entry.
Our discussion and categorisation of ICCF blunders already gave some consideration for how individual players can mitigate their risk and simultaneously create conditions to encourage opponents to blunder. This is an area worthy of further work and perhaps will be the subject of future articles in The Sealed Move. It would be an interesting project to conduct a more thorough analysis and categorisation of ICCF mistakes and blunders above 2400. A fifth of board losses at top level are now one-move collapses. This has grown from a negligible percentage a decade ago. One-move collapses, which look like process failures, are a growing share of the shrinking number of decisive games. World Champion GM Jon Edwards’ routine is the model we should all follow – stressing meticulous comparison of analysis positions and server positions and many checks before entering moves. When discussing his World Championship win, he told US Chess, “On moving, I again compare the position in my database with the official one on the ICCF server. Too many tournaments, even strong tournaments, are decided by human error when making a move. I thankfully managed to avoid clerical errors throughout the entire process.” It is when we are tired, distracted, or feel like we are under time pressure due to heavy game loads that we stray from that path and make move entry mistakes. Meanwhile, we can also try to feed opponents a bit more rope by looking for opportunities to deviate from common lines and choosing from equal candidates those that leave more room for an opponent to place a piece on the wrong square. Choose candidates that encourage opponents to make trades that simplify the positions into worse endgames – but always evaluate the resulting endgame at depth. Always be suspicious of any endgame analysis that is not grounded in a line that leads to a clear tablebase result.
What are the implications for ICCF to reduce the tendency of top events towards a lottery? The current focus by ICCF has been on exploring alternative tiebreaks. Proposals for different tiebreak systems include the Prediction Criterion tiebreak and the Rutar Tiebreak System (RTS).
The Prediction Criterion is an optional tiebreak adopted as Congress proposal 2024-045. It replaces “who had the better opponents” with “who prepared deeper conditional analysis.” The idea was to reward the players with longer and more accurate advance analysis, as evidenced by their conditional moves. The jury has not yet decided on this tiebreak system, which was recently tested by ICCF in the Janko Bohak Memorial. Reports from those that have played under this tiebreak (including SIM Fiedor) suggest that it significantly altered their approach to the game. Long conditional lines become a scoring asset. Opening choice is a double-edged sword. Well-trodden theoretical openings are easier to predict for both you and your opponent, whereas entering offbeat lines also makes it harder for you to predict the moves of your opponent. The game becomes focused on choosing non-inferior moves that are the least predictable, but which still limit choices for your opponent.
As discussed in the recent piece in The Sealed Move, Counting the Pieces, Proposal 2026-069 asked this year’s Congress for a one-year trial of the Rutar Tiebreak System. This system scores a drawn game based on the material for each side when the game ends. A win is worth five points, a loss zero. A draw is worth three points to the side with more material, one point to the side with less. Each player gets two points if material is level, and two points for draws prior to the 31<sup>st</sup> move. In Counting the Pieces, SIM Fiedor provides a thorough analysis of this tiebreak proposal and shows how it would have impacted past events. This was a controversial proposal which arguably makes a value judgement that the side with more material in a drawn game has demonstrated stronger play. One could question why the side that kept the game interesting by sacrificing some material should be penalised in the tiebreak, and this was the main objection the Polish delegate raised in the debate (his report, in Polish). Its proposer, ICCF Rules Director Dennis Doren, then withdrew it before the vote: delegates concluded the proposal was unnecessary, since a trial needs no rule change or infrastructure.
The evidence presented in this article suggests the issue is not entirely the fault of draws. The nature of the remaining decisive results also needs to be considered. It is tempting to suggest a framework to adjudicate decisive results to favour clear “wins over the board.” But we must also recognise that one of the players could have been skilful in choosing deviations to encourage these move-entry blunders. Before being overly critical of ICCF correspondence play, it is worth noting that blunders happen among top players in classical time controls too. Human error is inevitable in games played between humans (and cyborgs).
SIM Paweł Fiedor & IM Matt Tedesco
Methods
Square brackets are 95% confidence intervals. A p-value is the probability of seeing an effect at least as large as the one reported if there were no real effect; below 0.05 is conventionally called significant.
Approximately 1.6 million rated games from Opening Master OM CORR, release om_corr_2026_09, with 6,726 exact duplicate records removed. Games are banded on the lower of the two players’ ratings, so “2400 and above” means both players were at least 2400. Both players must be rated. The corpus contains only finished games, so nothing here is affected by games still in progress; section 6 deals with a different kind of censoring.
Years are start years, because the corpus records no completion date. Anything keyed on a year uses settled start years through 2022 only.
Every game-level series (draw rate, the decomposition, the floor and the ceiling) includes all games with no move-count floor. Anything measured on the moves requires fifteen full moves. That applies throughout, including the release-by-release vintage panel in Section 5.
Final positions were evaluated with Stockfish 19 at 500,000 fixed nodes, and at 10 million on a 5,000-game subsample. “Not lost” means the losing player’s final evaluation is strictly above −200 centipawns, taken per game rather than from binned totals. Drawn games were matched on band and year as a control. Full-game accuracy was swept at 100,000 nodes from move fifteen onward. A game counts as a single-move collapse when the loser’s position was within 75 centipawns of level, one move then cost at least 300, and the game ended within 12 plies; four other settings, from 50/400/8 to 125/200/20, are carried as checks, and the rising share holds at all five. Move-signature tests ran at 200,000 nodes with MultiPV 3 and were re-determined at 500,000 on all 12,750 extremum moves; no per-position judgement is quoted from the shallower pass. Every position discussed in Section 6 and every row of Figure 21 was also rechecked with Stockfish 19 at a fixed depth of 40 (one thread, 3 GB hash, Syzygy tablebases to seven pieces, AMD Ryzen 9 7950X); the positions, lines and settings are available on request.
The corpus is not exclusively ICCF, and games played under rules that prohibit engine use are a different kind of object from the ones this piece is about. On the Site header, which the corpus fills for every game, the population here is 97.1% ICCF, spread across fourteen organisations. The bodies whose events prohibit engines are almost absent at this strength: eight CCLA games, four IECC, none from the USCF. The largest non-ICCF block, at 2.0% of the band, is a German server whose games draw 76.1% against ICCF’s 89.3%. Restricting to ICCF events alone barely moves the accuracy comparison in Section 6: mean centipawns lost per move of 7.61 for collapse games against 15.39 for other board losses becomes 7.59 against 15.23, and the headline series hardly moves either. On ICCF games alone the floor at 2400+ is 16.13 per thousand against 16.14, the ceiling at f = 0.80 is 97.98% either way, the board-loss fall is 89.3% against 89.5%, and the administrative share in 2021–22 is unchanged at 42.55%. Non-ICCF games make up 5.6% of decisive games at 2400+ over 2012–2022, but 371 of those 382 started in 2012–14, and none in 2021–22.
The same check turned up one limitation. The rating headers are not a single scale: for players with substantial records on both sides, a non-ICCF rating averages about 125 points below the same player’s ICCF rating, and one site runs the other way. At 97% ICCF this barely affects the banding here, but it would matter for anything keyed on the edge of a band.
Player identity in the concentration figures is the normalised name, with the limitation stated in Section 4.