



First, an apology. The gap since the last post is longer than I intended, and I won’t dress it up as anything other than life getting in the way. Thank you to everyone who stayed subscribed through the silence.
Second, to everyone playing in the Champions League: good luck. The original group allocations were scrapped and the redrawn groups only appeared today, six days before play begins on the 15th. If you spent the past fortnight preparing against opponents you no longer face, you have my sympathy. May your first moves arrive on time even if the pairings didn’t.
While I was away from the keyboard I was not away from the database. I have a correspondence database running up to May 2026, and I wanted an answer to a simple question: what do strong correspondence players actually open with, and how has that changed over the engine era? Counts, not impressions.
The setup
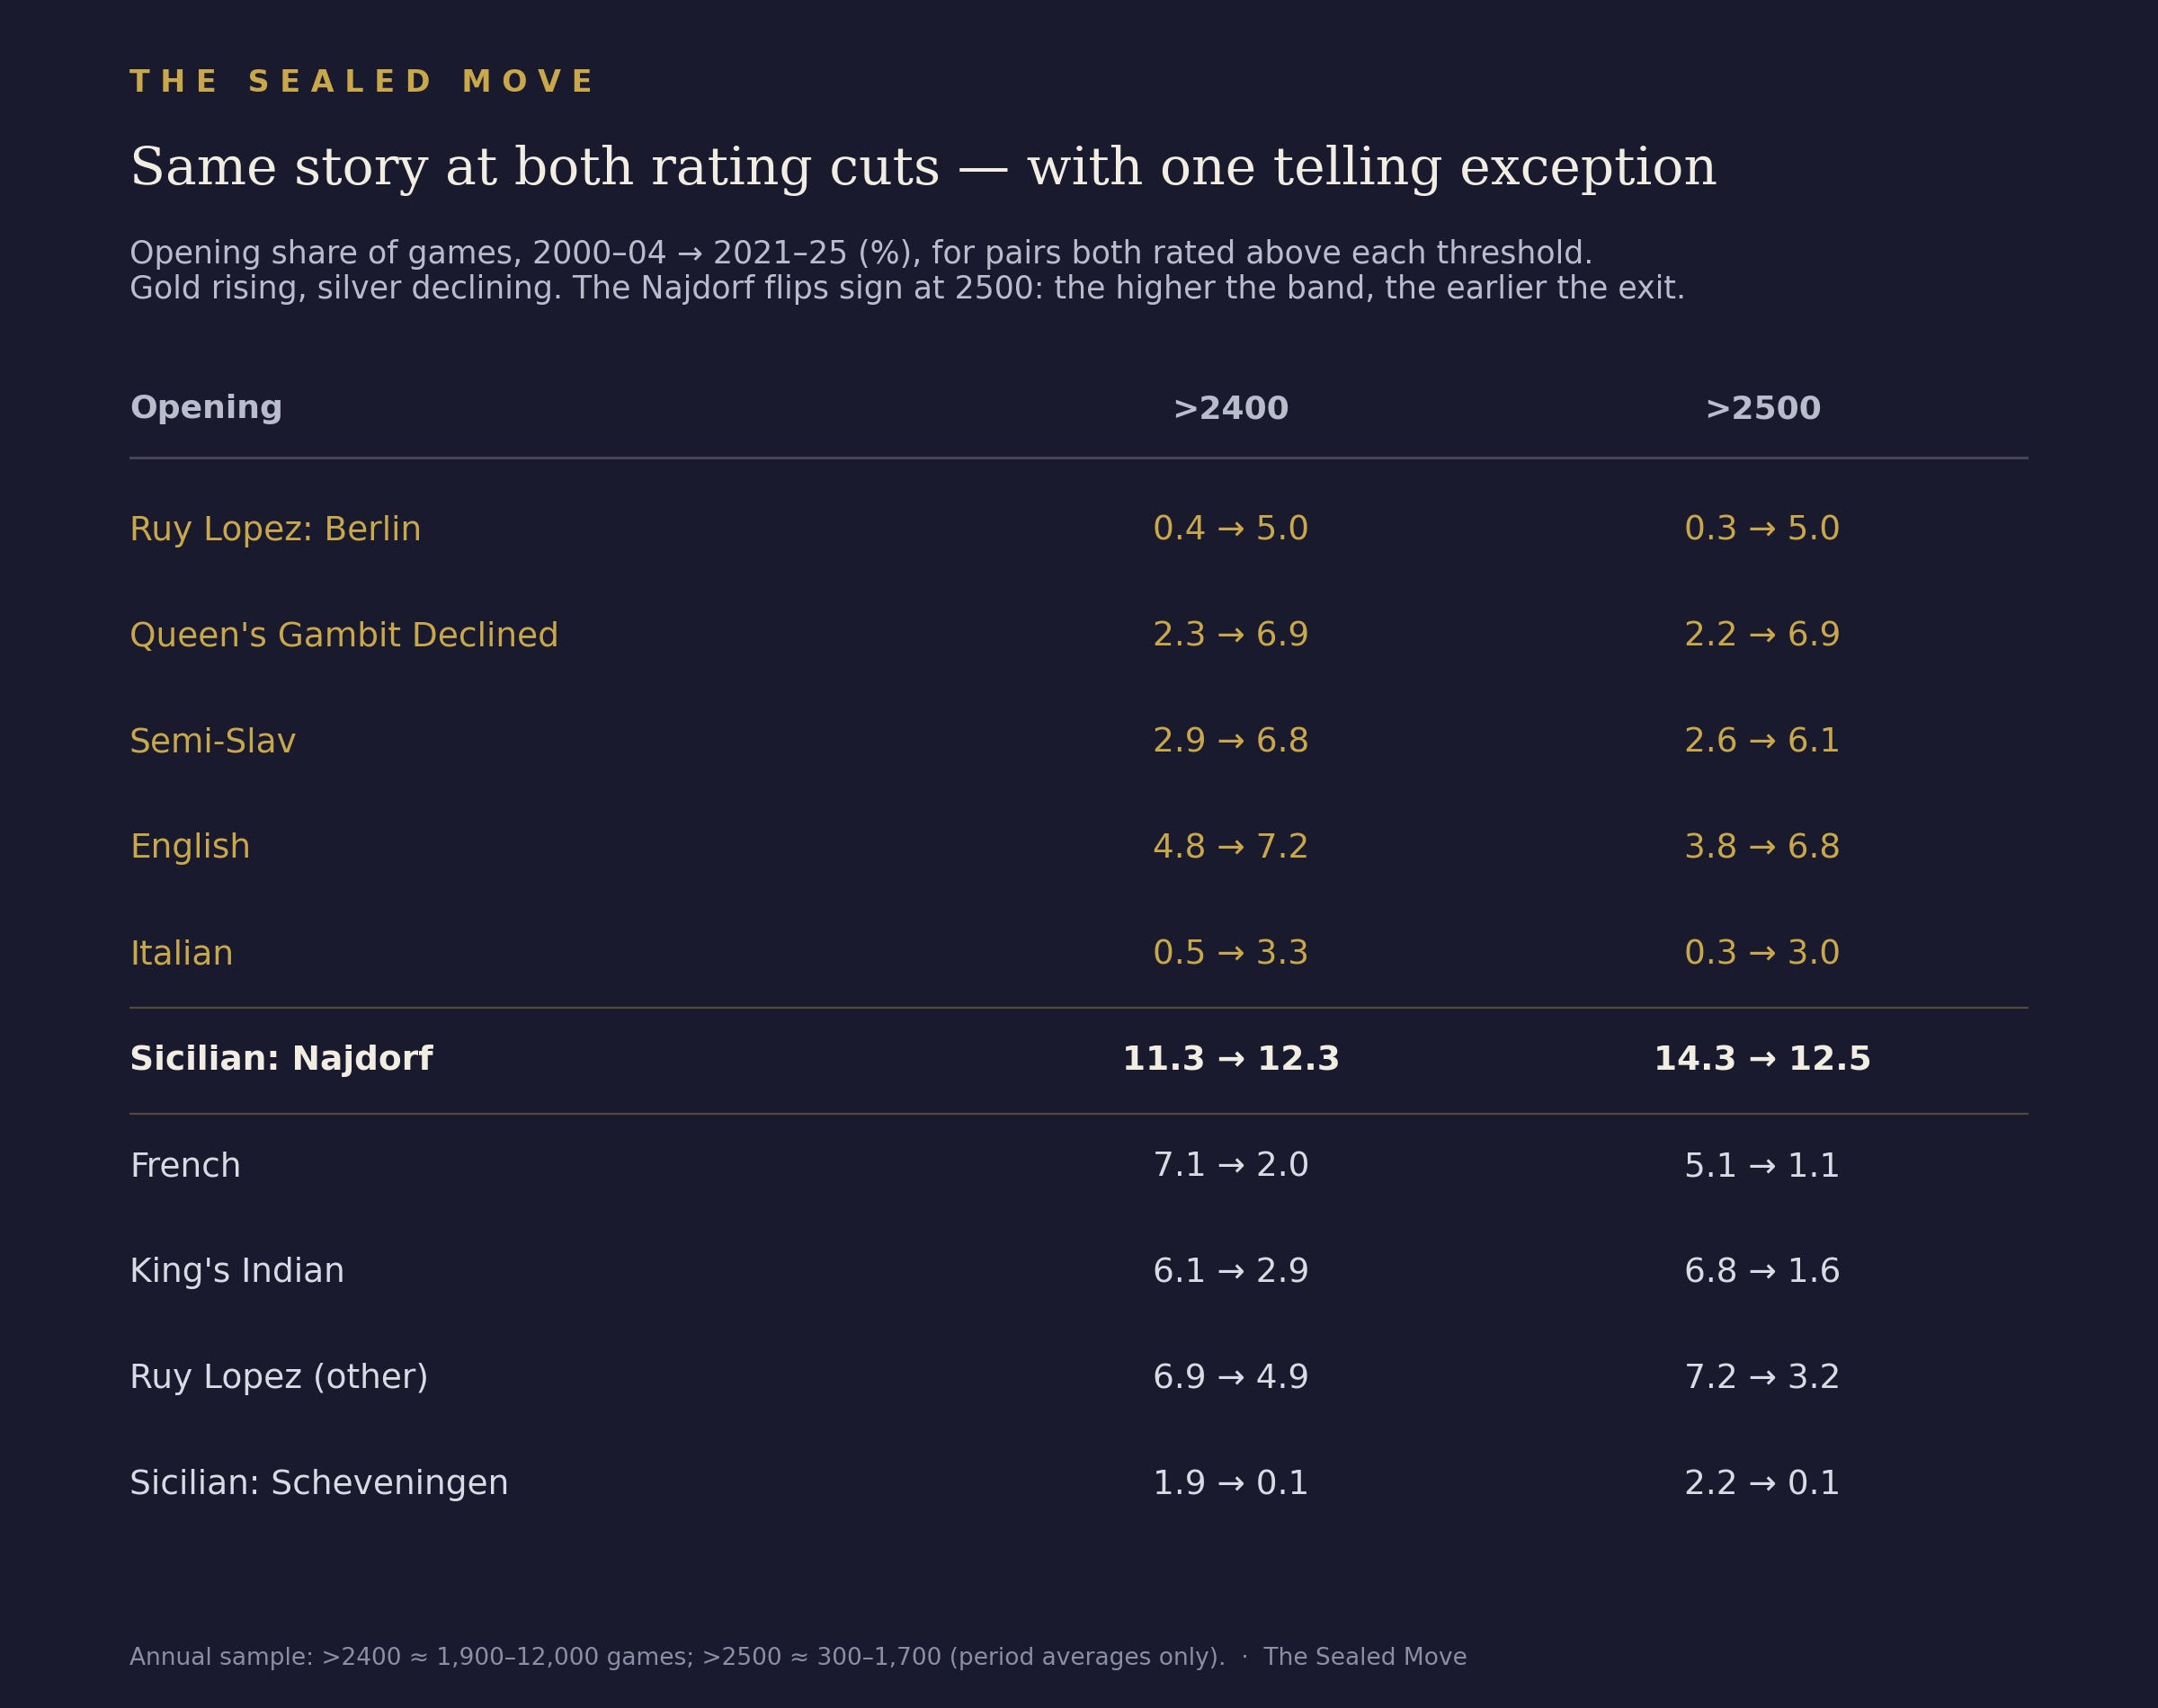
The raw material is roughly 1.6 million rated correspondence games. I split them into two groups. The first contains games where both players were rated above 2400. I will call this the 2400+ group rather than “the elite”: in modern ICCF terms it spans everyone from strong masters to the handful of players who actually steer the metagame, and a sceptic could reasonably ask for the same cut at 2500. I ran it. At 2500 the annual samples are small (roughly 300–1,700 games), so only period averages are usable, but on those averages every gainer below still gains and every loser still loses, several of the declines are steeper, and the one sign that flips concerns the Najdorf — covered in its own section, where the flip turns out to strengthen the argument rather than weaken it. The second group is everyone else with a rating. Unrated games were dropped.
Annual sample sizes for the 2400+ group run from roughly 1,900 games in 2000 to about 7,000 around 2021, dip to ~4,000 in 2022–23, then jump to ~10,000–12,000 in 2024–25 as recent events enter the database. The wider field contributes 23,000–84,000 games a year. Those swings are why every figure below is a within-group share for its year, why the small-multiples panels use a three-year average, and why I will not lean on any single recent year. The Najdorf chart is the deliberate exception: it is shown unsmoothed, with the coverage artifacts visible and flagged, because its 2015 peak is a specific annual value and I would rather show the noise than hide it. The partial year 2026 is excluded.
Every game was reclassified against a single ECO reference, so the trend lines measure changes in what people play rather than changes in how databases were tagged. ECO classification has a known weakness this audience will spot immediately: transposition. Move orders designed to dodge preparation blur the English into the QGD and Catalan complex, and some of my buckets (”Rossolimo / misc”, “Queen’s Pawn / London”) are visibly heterogeneous. The headline shifts are far too large to be classification noise, but treat single-point differences accordingly. One more caveat in the same spirit: the 2400+ population itself is not constant over 25 years. Changes in who plays serious correspondence chess could move these lines independently of anything engines say. I can control for tagging drift; I cannot control for player-pool drift.
What moved
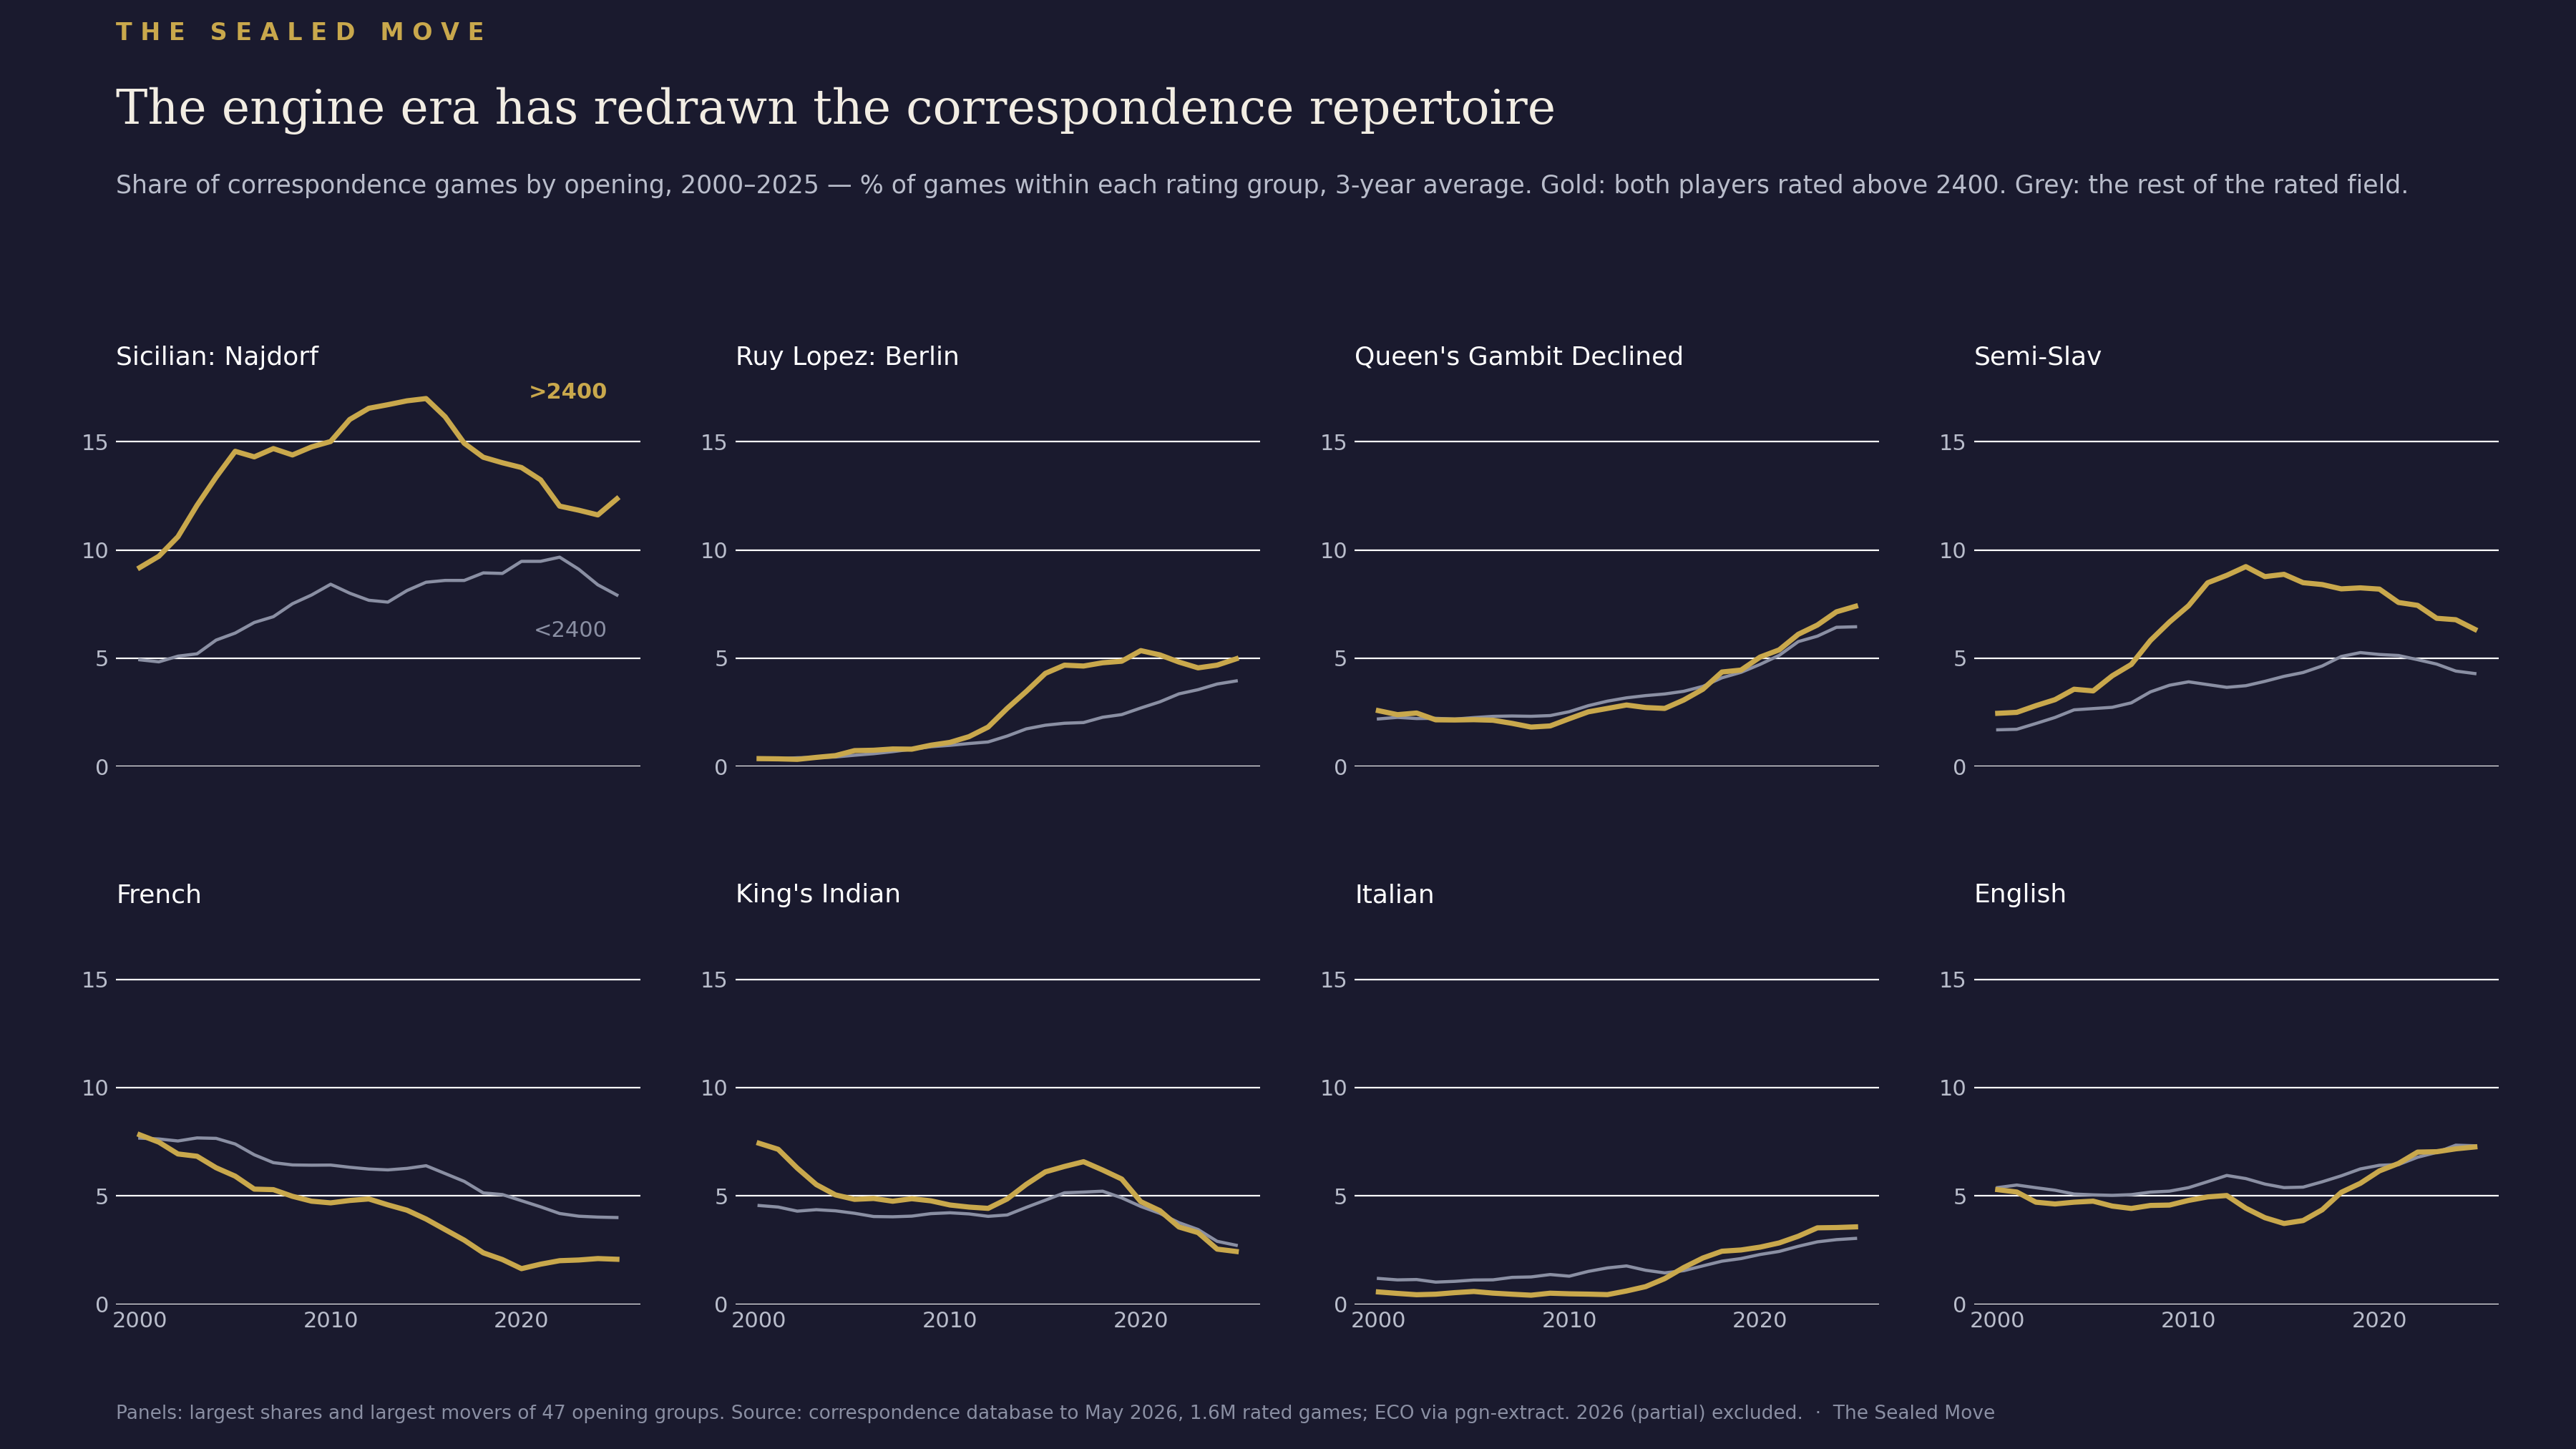
Eight openings, twenty-five years, two rating groups. The panels were chosen as the largest shares and largest movers; the full table covers 47 opening groups and ships with the follow-up post.
The gainers first, described as the lines actually run. The Queen’s Gambit Declined roughly tripled its 2400+ share since the early 2000s and is still rising. The Italian, a rounding error above 2400 in 2004, now takes over 3% of games. The English is a recovery story rather than a steady climb: it sagged from around 5% to under 4% by the mid-2010s, then rose to over 7%. The Semi-Slav is the awkward one for any tidy narrative, and I’d rather flag it than smooth it: it surged from under 3% to a peak near 9% around 2013–14 and has been retreating for a decade since, to between 6 and 7%. Whatever the 2400+ group found in the Semi-Slav in the late 2000s, it has been slowly walking away from it ever since, while the wider field’s share is still near its high.
The losers are more uniform. The French fell at the top from over 7% of games to 2%, a steeper fall than in the wider field. The King’s Indian followed the same path. The sharp Sicilians thinned out one by one, and the Scheveningen, an opening Kasparov built a world championship career on, went from 1.9% of 2400+ games to 0.1% — a few dozen games across the last five years, out of some 37,000. I called that functionally extinct in an earlier draft and I’ll stand by it; at this sample size the share could double and the conclusion wouldn’t move.
Then versus now
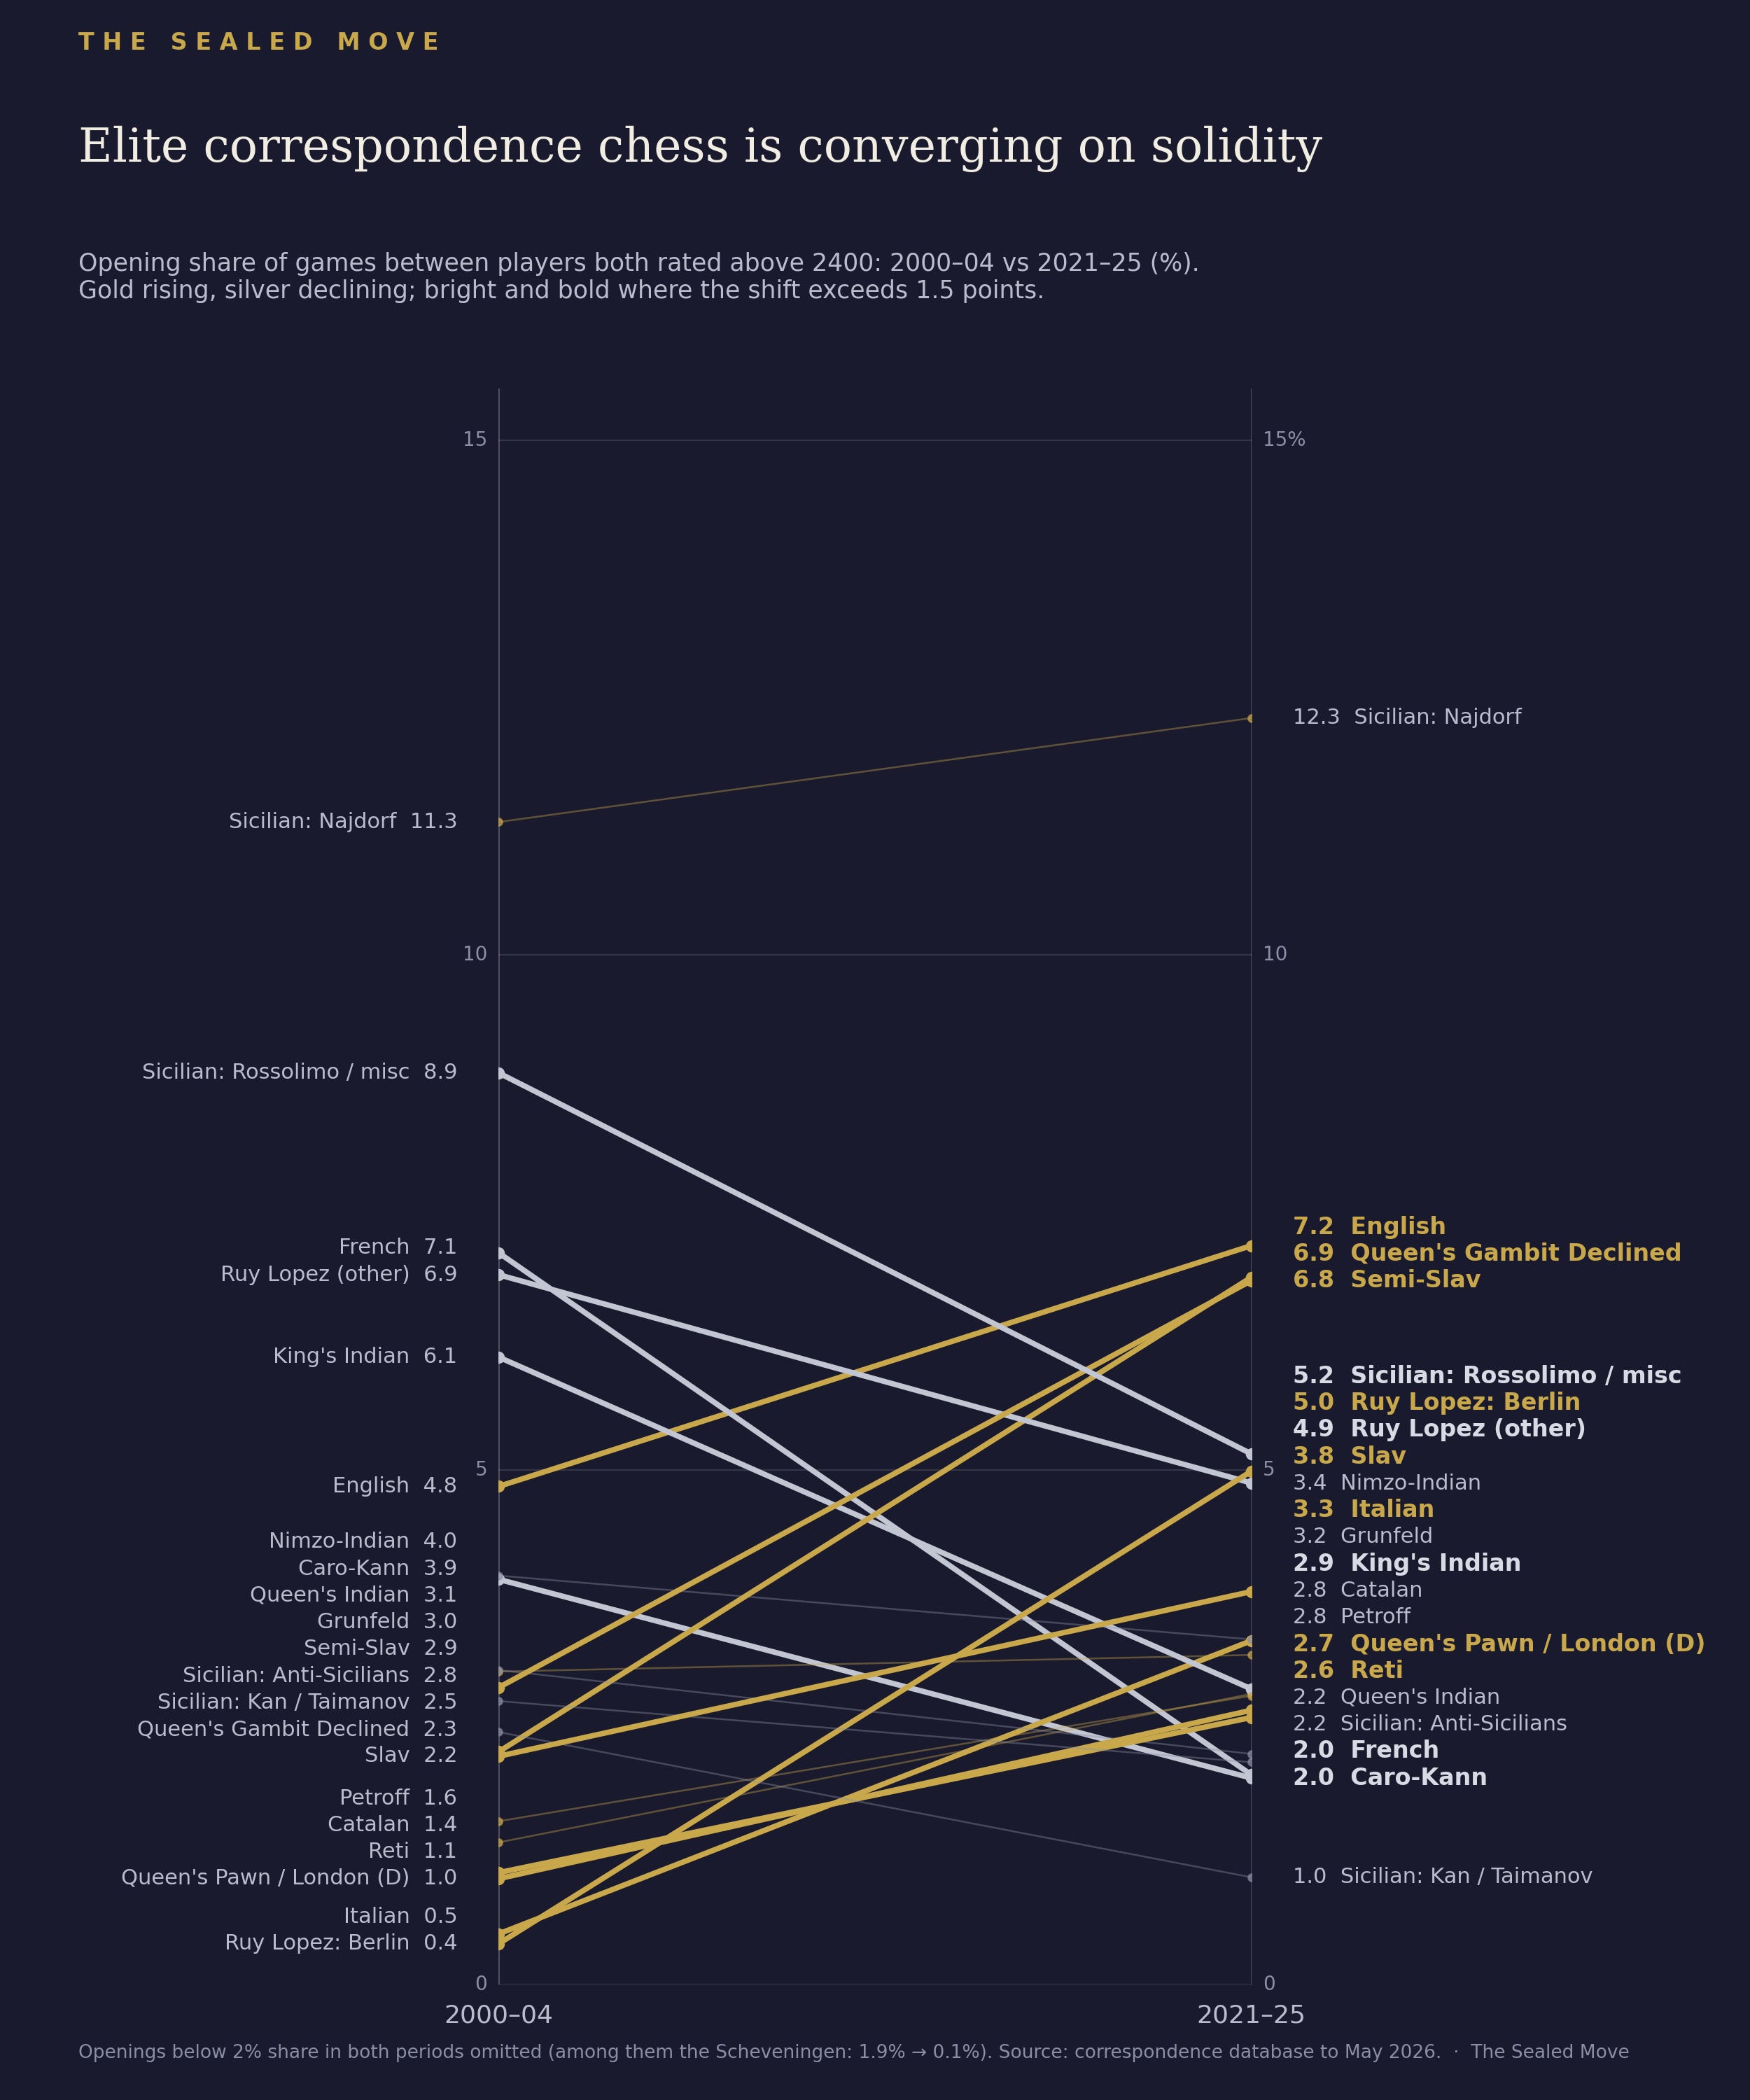
The slope chart compares 2000–04 with 2021–25. Endpoint comparisons hide timing, as the Semi-Slav above and the Najdorf below both demonstrate, so read this chart for magnitudes and direction, then check the time series before trusting any individual line.
One line justifies the whole exercise. In the first version of this analysis the Ruy Lopez appeared as a single block and looked like a modest gainer. Splitting out the Berlin complex (C65–C67, which includes the 4.d3 Anti-Berlin, so not every game here is an endgame grind) changes the picture: the Berlin went from 0.4% of 2400+ games to 5.0%, the steepest rise of any line measured, while the rest of the Spanish declined from 6.9% to 4.9%. The Ruy Lopez did not grow. The Berlin ate it from the inside, and the aggregate hid the meal.
The timing is worth a sentence, because it complicates the story I wanted to tell. The Berlin’s rise is concentrated between 2010 and 2015 — from 1% to over 4% — and it has plateaued since. That is before the NNUE era, and it coincides with the opening’s over-the-board revival. Correspondence players reached the same verdict as Kramnik in 2000 with rather more computation behind them, but on this evidence they reached it when the OTB elite did, not years ahead. The diffusion ran in both directions.
Two reading aids for the chart as a whole. The bolded gold and grey lines mark shifts above 1.5 percentage points. And despite all the crossing lines, the top of the distribution remains concentrated: the five largest openings still account for roughly two-fifths of 2400+ games. The repertoire narrowed; it did not scatter.
The Najdorf
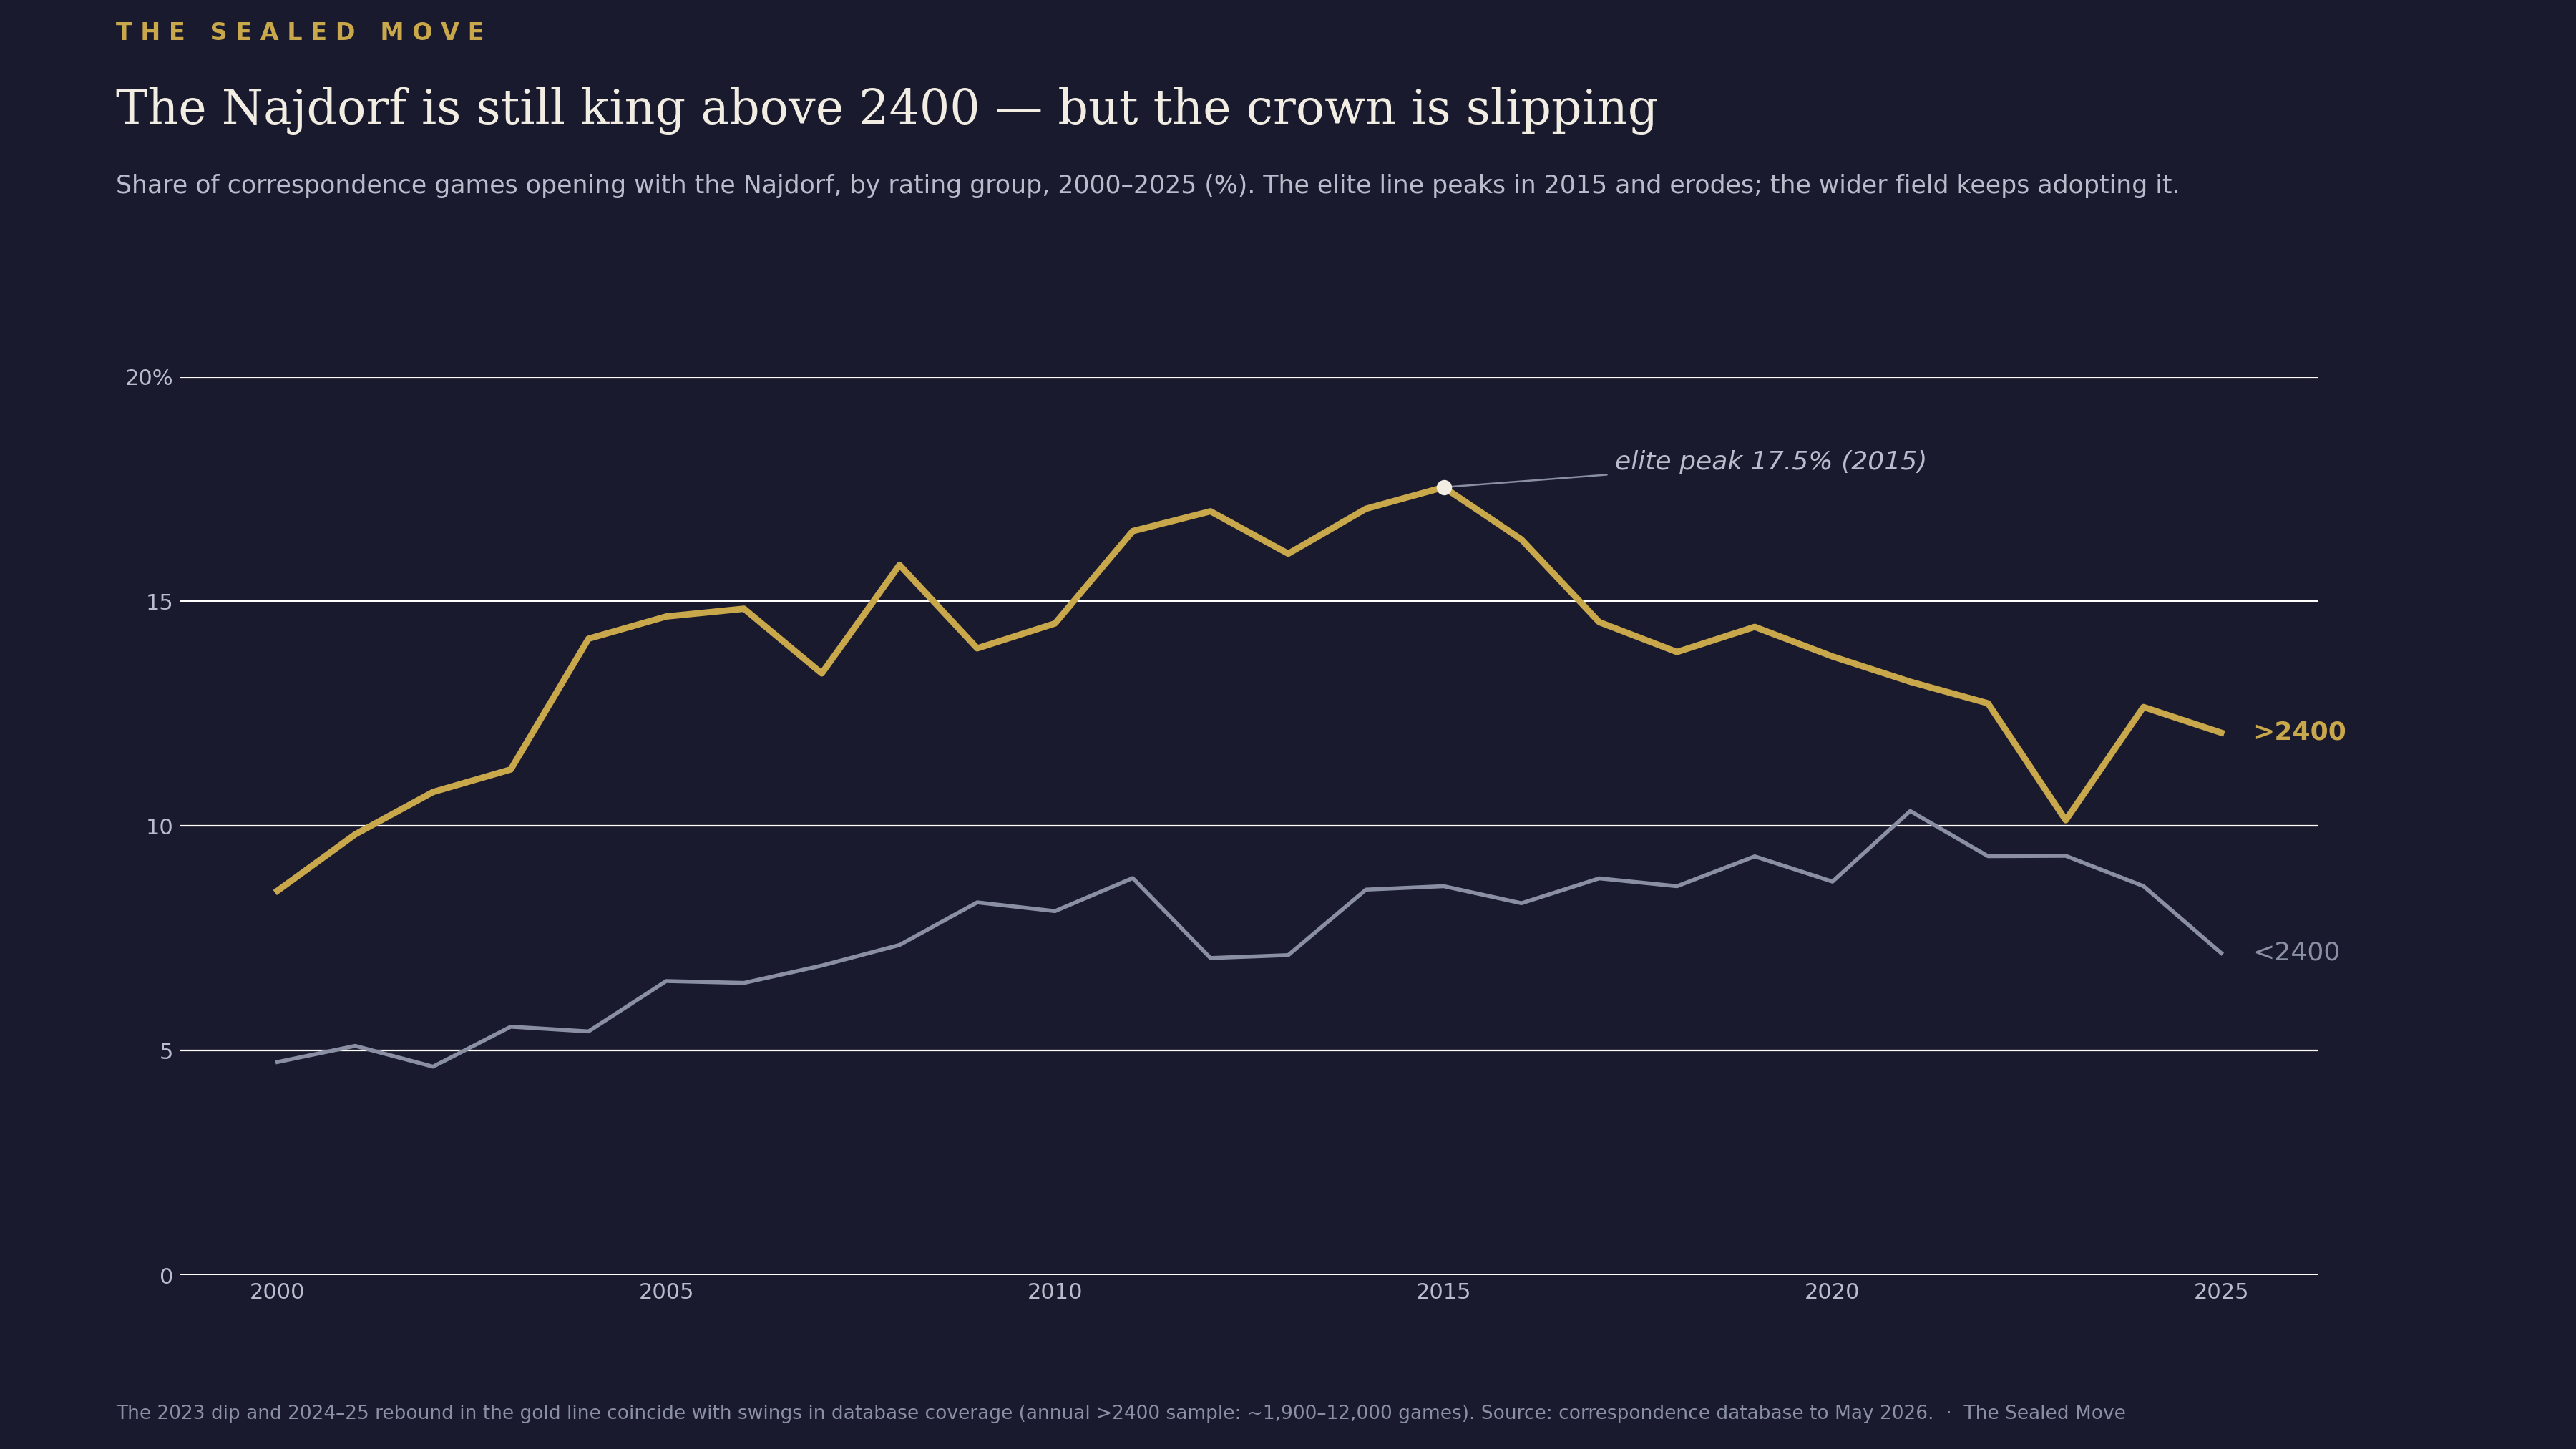
The Najdorf is where the slope chart and the time series appear to disagree, and the disagreement is instructive. On the slope chart the Najdorf gained: 11.3% in 2000–04 to 12.3% in 2021–25. On the time series it peaked at 17.5% in 2015 and has eroded since, to around 12% in recent years. Both are true. The slope chart’s endpoints straddle the peak, so a rise-and-decline registers as a small net gain. This is the strongest argument for publishing the time series alongside any before/after comparison.
So the accurate statement is double-edged. The Najdorf has lost roughly a third of its peak share among 2400+ players over the past decade. It also remains the most played opening in that group by a wide margin, and the wider field has kept adopting it throughout, from about 5% in the early 2000s to between 9 and 10% now.
The 2500 cut sharpens this picture. For pairs both rated above 2500, the endpoint comparison itself turns negative: 14.3% in 2000–04 down to 12.5% in 2021–25. The Najdorf was already near its ceiling at the very top of the rating list two decades ago, and the higher the band, the earlier the exit begins. That gives the chart a third rung. The 2500+ group peaked first, the 2400 band peaked around 2015, and the field below is still climbing. Whatever is driving the migration moves down the rating list from the top.
Why the divergence between the groups? I see two candidate explanations, and the data cannot separate them.
The first is discovery exhaustion. Twenty years of engine analysis at correspondence time controls is a discovery process whose scale, if not its kind, has no real OTB equivalent, and the 2400+ group ran it first and hardest. As viable novelties thin out at the depths they analyse, the opening’s practical yield above 2400 falls, and the share follows with it. On this reading the wider field plays the Najdorf today for the reason the 2400+ group played it in 2010, and the lag is informational.
The second is incentives. Above 2400, both sides reach the same engine-approved positions and implement them near-perfectly; the marginal value of sharpness is close to zero, so players drift toward lines that are cheaper to maintain. Below 2400, opponents’ implementation is leakier and sharpness still converts into points. On this reading the lag is not the field catching up to the elite; it is two populations rationally choosing differently because they face different opponents. Nothing in these charts distinguishes the two stories, and the honest position is that both are probably operating.
And why does the Najdorf keep the crown despite the erosion? Because nothing refuted it. My reading — and this is a conjecture about engine behaviour, not something these charts measure — is that its critical evaluations hold at depth in a way the Scheveningen’s did not: engine-stable sharpness rather than a tactical lottery. Testing that properly would mean line-level evaluation tracking across engine generations, which is a different article. The migration in these charts is not from sharp openings to quiet ones. It is from lines whose evaluations wobble under depth to lines whose evaluations hold, and the Najdorf, inconveniently for a tidy headline, sits in the second group.
What I take from this
The demonstrated finding is descriptive: since 2000, 2400+ correspondence players have concentrated their repertoire into a narrower set of openings whose engine evaluations are stable at extreme depth, and they have moved measurably faster than the rest of the rated field. The mechanism — verdict-driven abandonment, incentive differences, pool composition, or all three — is interpretation, and I have tried to mark the boundary honestly.
For repertoire purposes the practical readings survive the caveats. The 2400+ group’s choices have tended to move ahead of the wider field in these charts, and on that record they are a useful early signal for where the rest of the rated pool is heading — not a validated forecast, and the Berlin episode is a warning that the signal sometimes arrives from outside correspondence entirely. And for readers who love the Scheveningen, the data’s advice is unsentimental: play it below 2400, where it still exists.
The closing thought connects to the engine-philosophy material from earlier posts, stated at the strength the evidence supports. These charts show selection toward openings that survive deep scrutiny. They do not show that correspondence chess has found the truth of the opening; they show what remains when twenty-five years of computation strips away everything that doesn’t hold. Whether that residue is solid ground or just the ground nobody has yet found the fault line in is a question for a future database.
If there’s interest, the full pipeline behind these charts, from raw PGN to the final images, will be the subject of a follow-up post for anyone who wants to run the same analysis on their own database, at either rating cut.
SIM Paweł Fiedor
Source: correspondence database to May 2026, ~1.6M rated games. 2400+ group: both players rated above 2400 (annual n ≈ 1,900–12,000); wider field: all other rated games (annual n ≈ 23,000–84,000). Sensitivity cut at 2500 (annual n ≈ 300–1,700, period averages only): directions of change unchanged for every group except the Najdorf, whose small endpoint gain at 2400 becomes a decline at 2500 — see the Najdorf section. Endpoint shares (2000–04 → 2021–25, %):
Loved your analysis of the changing preferences for opening choices in top level ICCF chess. A great assessment based on the statistical evidence from the game data. I will be really interested to see how these preferences change in the next year or so.
What I find interesting is that I think the discussion of how to create winning chances in ICCF play really needs to be explored from a meta game level. We have reached a point where virtually everything is drawn with correct play. Most unicorn wins are the result of "administrative errors." Those players that are capable of playing more games than their competitors without increasing the chance they make an administrative error themselves will, over the long run, collect more unicorn wins. One must try to create your own "luck."
I think a key question needs to be what will offer me the most practical chances from an ICCF perspective recognizing both sides have their resources. Given a range of candidates all of which are 0.00 with accurate play, what lines force the opponent to make choices and spend time rather than "spacebar" their way through. Every time an opponent needs to actually make a choice is a small potential failure mode in their game. I am not speaking exclusively of mistakes in the OTB sense. But human error at the "administrative error" level as well. People putting pieces on the wrong squares in a hurry to get their move entered having had their analysis session cut short by a real-world distraction is one example. The chance of such an ICCF blunder is increased if they need to do some analysis in the first place.
In ICCF we live Katronias' "How to Play Equal Positions" at a massive scale compared to OTB. But a lot of the advice in his book I think is particularly good for ICCF players. The way he characterizes equal positions that appear dry into Type A Planless (No-Plan/Move-by-Move), Type B Plain-Plan Equality, Type C Calculated Risk, and Type D Prophylactic Attack is interesting. ICCF players find themselves living in Type A and Type B positions for the most part.
It will be interesting to see how the reality that modern engines just say everything is 0.00 will continue to influence ICCF play.
So if a correspondence player were to create a repertoire in today’s NNUE world what should they choose for the best results?