



The Joop van Oosterom Memorial started in 2017 with nine grandmasters. One player’s games were cancelled. The other eight, averaging 2646, played 28 games among themselves, and all 28 were drawn. The final ICCF crosstable, with its last result on 31 March 2020, shows eight names in first place on 3.5 points, no wins, and an identical Sonneborn-Berger score of 12.25. Under ICCF Rules §1.3.4(5), players still level after every tiebreak “will be considered equal”. In this event the rules did what they say.
Proposal 2026-069, on the Congress agenda this month, asks for a one-year trial of a tiebreak that would have given that event one winner. The Rutar Tiebreak System scores a drawn game by the material on the board when it ends. Under it, Aleksandr Dronov finishes first. He drew all seven games like everyone else. In two of them, both with Black, the game ended with him a pawn up.
That is the question this piece is about. When RTS picks a winner out of a table of draws, what is it picking on? The proposal’s evidence is one unfinished event, 35 games. OM CORR holds tens of thousands of finished ones. I scored every draw of 2016–2020 in which both players were rated 2400 or more, 26,998 games, and every complete round robin on the ICCF server from 2010 to 2020 averaging 2400 or more that the database holds in full, 172 events. The short version is that RTS measures something real and small, and a great deal of what it scores is when the game happened to stop.
The rule, and what it was tested on
As the proposal sets it out, a win is worth 5 points and a loss 0. A draw is worth 3 to the player with more material at the end (counting P=1, N=B=3, R=5, Q=9), 1 to the player with less, 2 each if material is level, and 2 each if the draw came “before the 31st move”. Ties on game points are broken by RTS total, then the results between the tied players, then Sonneborn-Berger, then wins with Black, then total wins. ICCF’s current order for round robins (§1.3.4, 2.1) is wins, then Sonneborn-Berger, then the results between the tied players.
Proposal 2026-069, “Trial Period for the Rutar Tiebreak System”, was put to this year’s Congress by Dennis Doren, ICCF’s Rules Director, and is on the ICCF Congress 2026 proposals page (iccf.com/Proposals.aspx?id=80, members’ login). Its test event, which the proposal does not name, was organised by IA Jörg Kracht from 15 November 2025 and has 13 players rated 2500 to 2640. As of 9 August, 35 of its 78 games had finished, all drawn; 12 were scored 3–1 and 23 were scored 2–2. In a survey the Rules Director reports in the proposal, twelve of the thirteen players said that the system changed how they chose moves, several of them that they had played a “second choice” move to avoid losing material.
That last fact limits what follows. The games I score were played by people who did not care how much material was on the board at the end. RTS asks them to care. Historical games can show what the rule measures in play that ignores it; they cannot show how play changes once it doesn’t. I come back to it at the end.
Two draws in five are out of reach
Start with what RTS cannot touch. Of the 26,998 elite draws of 2016–2020, 10,820 ended within 60 plies, before White’s 31st move. That is 40.1% (38.9% to 41.2%, with the uncertainty computed by resampling whole events, since short draws cluster by event). Every one of them scores 2–2 whatever is on the board. The share has stayed between 37% and 44% in every settled year from 2010 to 2020, with no trend (−0.24 points a year, p = 0.21).
The phrase “before the 31st move” has one genuine edge case. A draw agreed after White’s 31st move and before Black replies has completed 30 moves by both sides and 31 by one. Read as short, the exempt share rises to 42.7%. The proposal should say which it means, and for reasons that come up in the standings, it matters.
Nothing in ICCF’s rules sets a minimum move for agreeing a draw; §2.9 and §3.15.2.3 only stop a player repeating a declined offer within ten moves. So under RTS an early agreement is a way of locking in 2–2. It takes two players. A player who expects to end a pawn down has a reason to offer one, and the opponent has a reason to decline. Whether early agreements rise under the trial is one of the things it can measure.
What a favoured draw is
The other 16,178 draws went past the cutoff, and in 8,200 of them (50.7%) one side ended with more material. White did so 5,272 times and Black 2,928, nearly two to one. Two-thirds of the imbalances are a single pawn. The most common endings are the ones every correspondence player knows: rook and two pawns against rook and pawn (181 games), rook and three against rook and two (141), rook and four against rook and three (112).
The material in these games is often decorative. In 716 (8.7%) the final position is a tablebase draw, the extra material provably worth nothing. In 284 (3.5%) the final position had recurred and the side with less material had given check on each of its last three moves: checking into a repetition. That is the shape of the case the proposal’s critics raised in the Congress comments, the player who gives up material for a perpetual and is scored as the loser of the draw. My classifier is a screen, not a proof that the repetition was forced, and it counts tablebase draws first, so it can miss some. On this count the case exists and is uncommon.
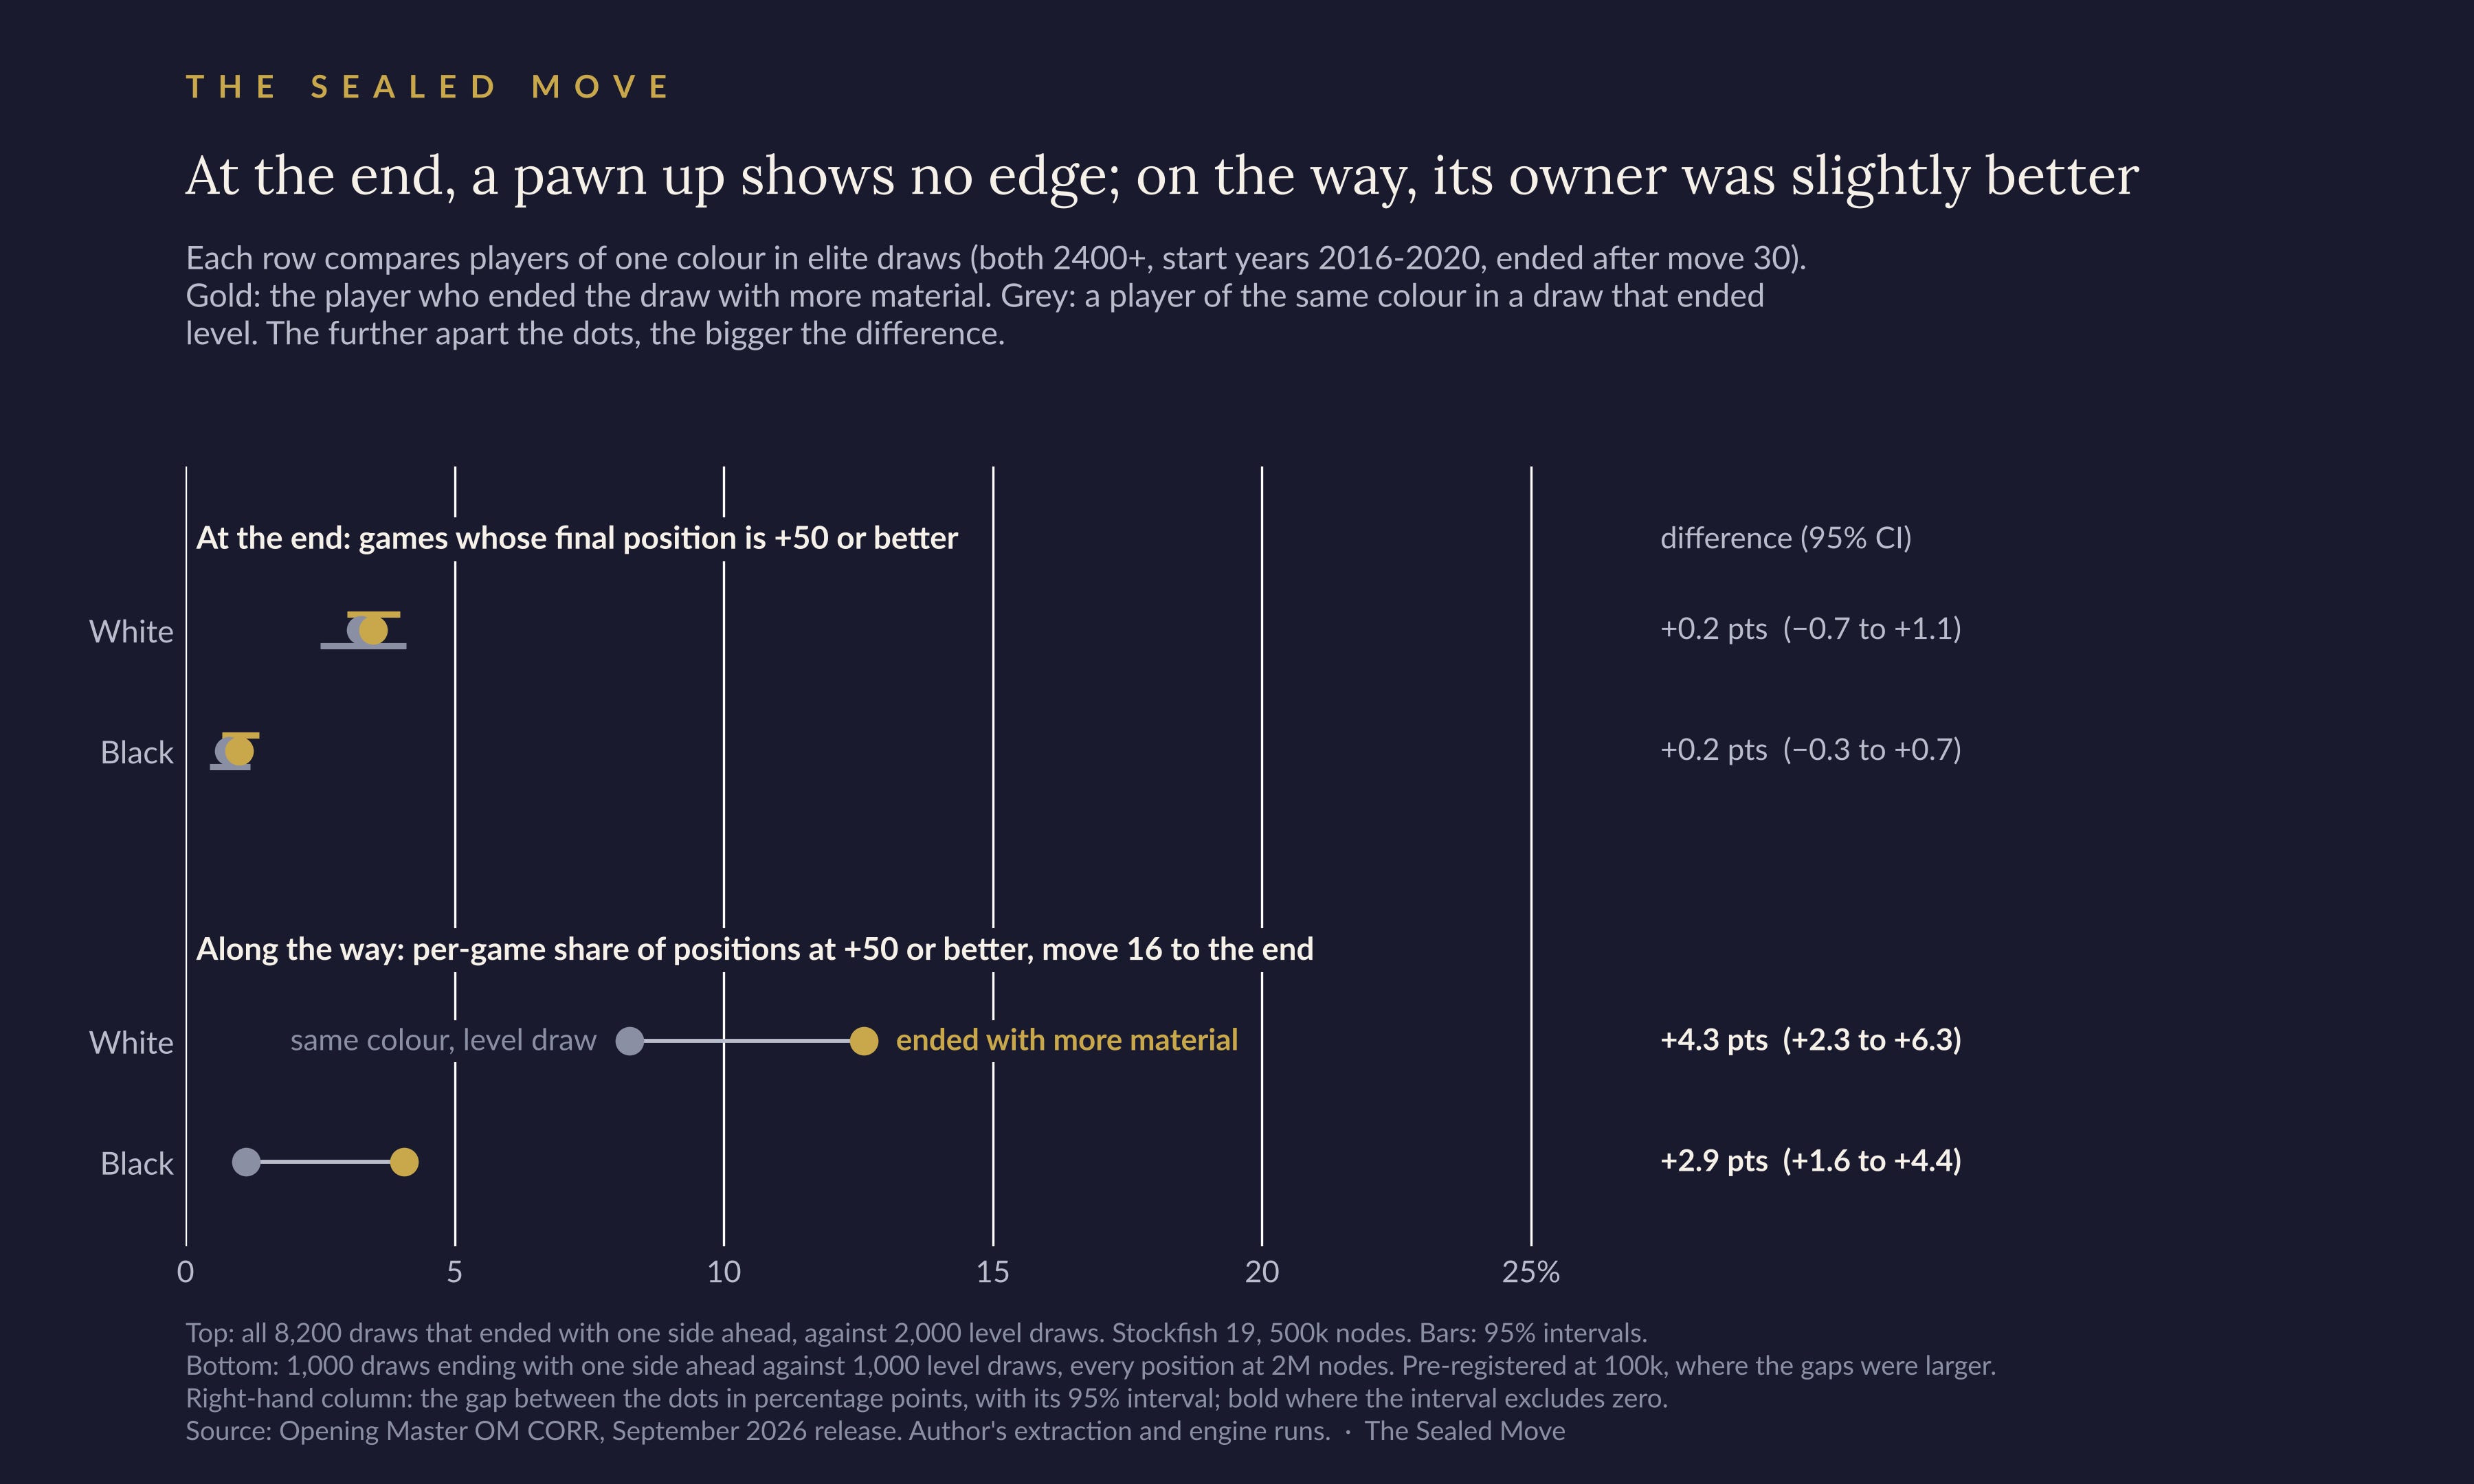
The rest the engine has to judge. Scored from the side with more material, with Stockfish 19 at 500,000 nodes per position (one thread, Syzygy 3–6 men and part of 7, on an AMD Ryzen 9 7950X), the final positions of favoured draws are at +50 or better slightly more often than those of level draws, and the difference disappears once colour is held fixed. White ahead in a favoured draw is at +50 or better 3.5% of the time; White in a level draw, 3.25%; the difference is +0.2 points, with an interval from −0.7 to +1.1. For Black the figures are 1.0% and 0.8%. Searched again at 50 million nodes (the median depth the engine reported rose from 22 to 61), most of those small advantages go: of the 18 sampled positions that were +50 or better at the shallower search, 15 came out level. Eighteen is too few to put a number on, and the check covers final positions only.
So in the final position, colour for colour, favoured draws are not detectably more often at +50 or better than level ones. Some extra pawns do come with an edge; the comparison simply cannot tell the two groups apart. That is not, on its own, an argument against RTS, and I had it wrong in the first version of this analysis. The best case for the rule is not that a pawn up at the end is worth something. It is that a player who finishes with more material is usually the one who pressed, and that the material is what is left of the pressing when the position has run out. If that is right, a level final position is what you would expect to see, and the final position is the wrong place to look.
So I looked along the way. Before any of it was run, and before the sample was even drawn, I wrote the test down: take 1,000 favoured draws and 1,000 level ones, evaluate every position from move 16 to the end (every position after ply 30) at 100,000 nodes, and compare the side that ends ahead with the same colour in the level draws. If its average evaluation and its share of positions at +50 or better were both higher, with intervals excluding zero, I would count that as support for the pressing case.
They were. White, when it ended ahead, averaged +22.7 over the game against +16.3 in level draws, a difference of +6.4 (+3.9 to +9.0), and was at +50 or better in 19.2% of positions against 12.7%, +6.5 points (+4.1 to +8.9). Scored from Black’s side, Black when it ended ahead averaged −9.7 against −16.3 in level draws: still slightly worse, because White’s first-move edge persists, but less so, by +6.6 (+2.7 to +10.1). It was at +50 or better in 6.3% of positions against 2.1%, +4.3 points (+2.6 to +6.2). Each game counts once, the samples were drawn by a seeded rule fixed in advance, and the intervals come from resampling whole games.
A test at 100,000 nodes a position is a shallow look for this readership, and a smaller subset searched deeper suggested the gaps would shrink. So I fixed the same reading in advance again and searched all 110,896 positions at 2 million nodes, a median depth of 25 against 15. Every gap shrank, by between a fifth and a third, and every one stayed above zero. White’s edge in positions at +50 or better fell to 4.3 points (+2.3 to +6.3), Black’s to 2.9 (+1.6 to +4.4); in average score, +4.6 for White and +5.2 for Black. Resampling whole events instead of games barely moves the intervals. The side that finishes with more material was, on the engine’s view, slightly better slightly more often. The supporters of RTS are right about that, and the piece I set out to write said otherwise.
The chart puts both tests side by side. Every row compares two players of the same colour. The gold dot is the player who ended the draw with more material; the grey dot is a player of that colour in a draw that ended level. Where the two dots sit on top of each other, the comparison finds no difference; the gap between them is the estimated difference, and the column on the right gives it in percentage points with its interval. The top half asks how often the final position was +50 or better: the dots overlap, for White and for Black. The bottom half asks in what share of positions, from move 16 to the end, the player was +50 or better: for both colours the gold dot sits clearly to the right. The bottom half shows the deeper search.
Two things limit how much it carries. At the deeper search the difference is about five centipawns on average, and it shrinks as the engine looks harder. Matching each game to level draws of the same length (within four plies) leaves White’s gap in positions at +50 or better at 4.9 points (+2.4 to +7.3) and Black’s at 4.0 (+2.3 to +5.9), at 100,000 nodes; keeping only the positions before the material was won leaves the gaps slightly larger, so it is not the winning of the material itself showing up in the evaluation. And the material usually arrived late. Tracking the material count after every ply from ply 30, the side that finished ahead had held that edge without interruption for only the last six plies in the median favoured draw; in 22% of games the edge appeared with the very last move.
In 1,390 favoured draws (17.0%), the last move was a capture and the opponent could legally recapture on the same square. I played every such recapture on a copy of the final position and recounted. In 694 a recapture leaves the material level, and in 415 it reverses it. In 86% of the 1,390, the engine’s best move in the final position, read from the same Stockfish 19 search at 500,000 nodes, is that recapture.
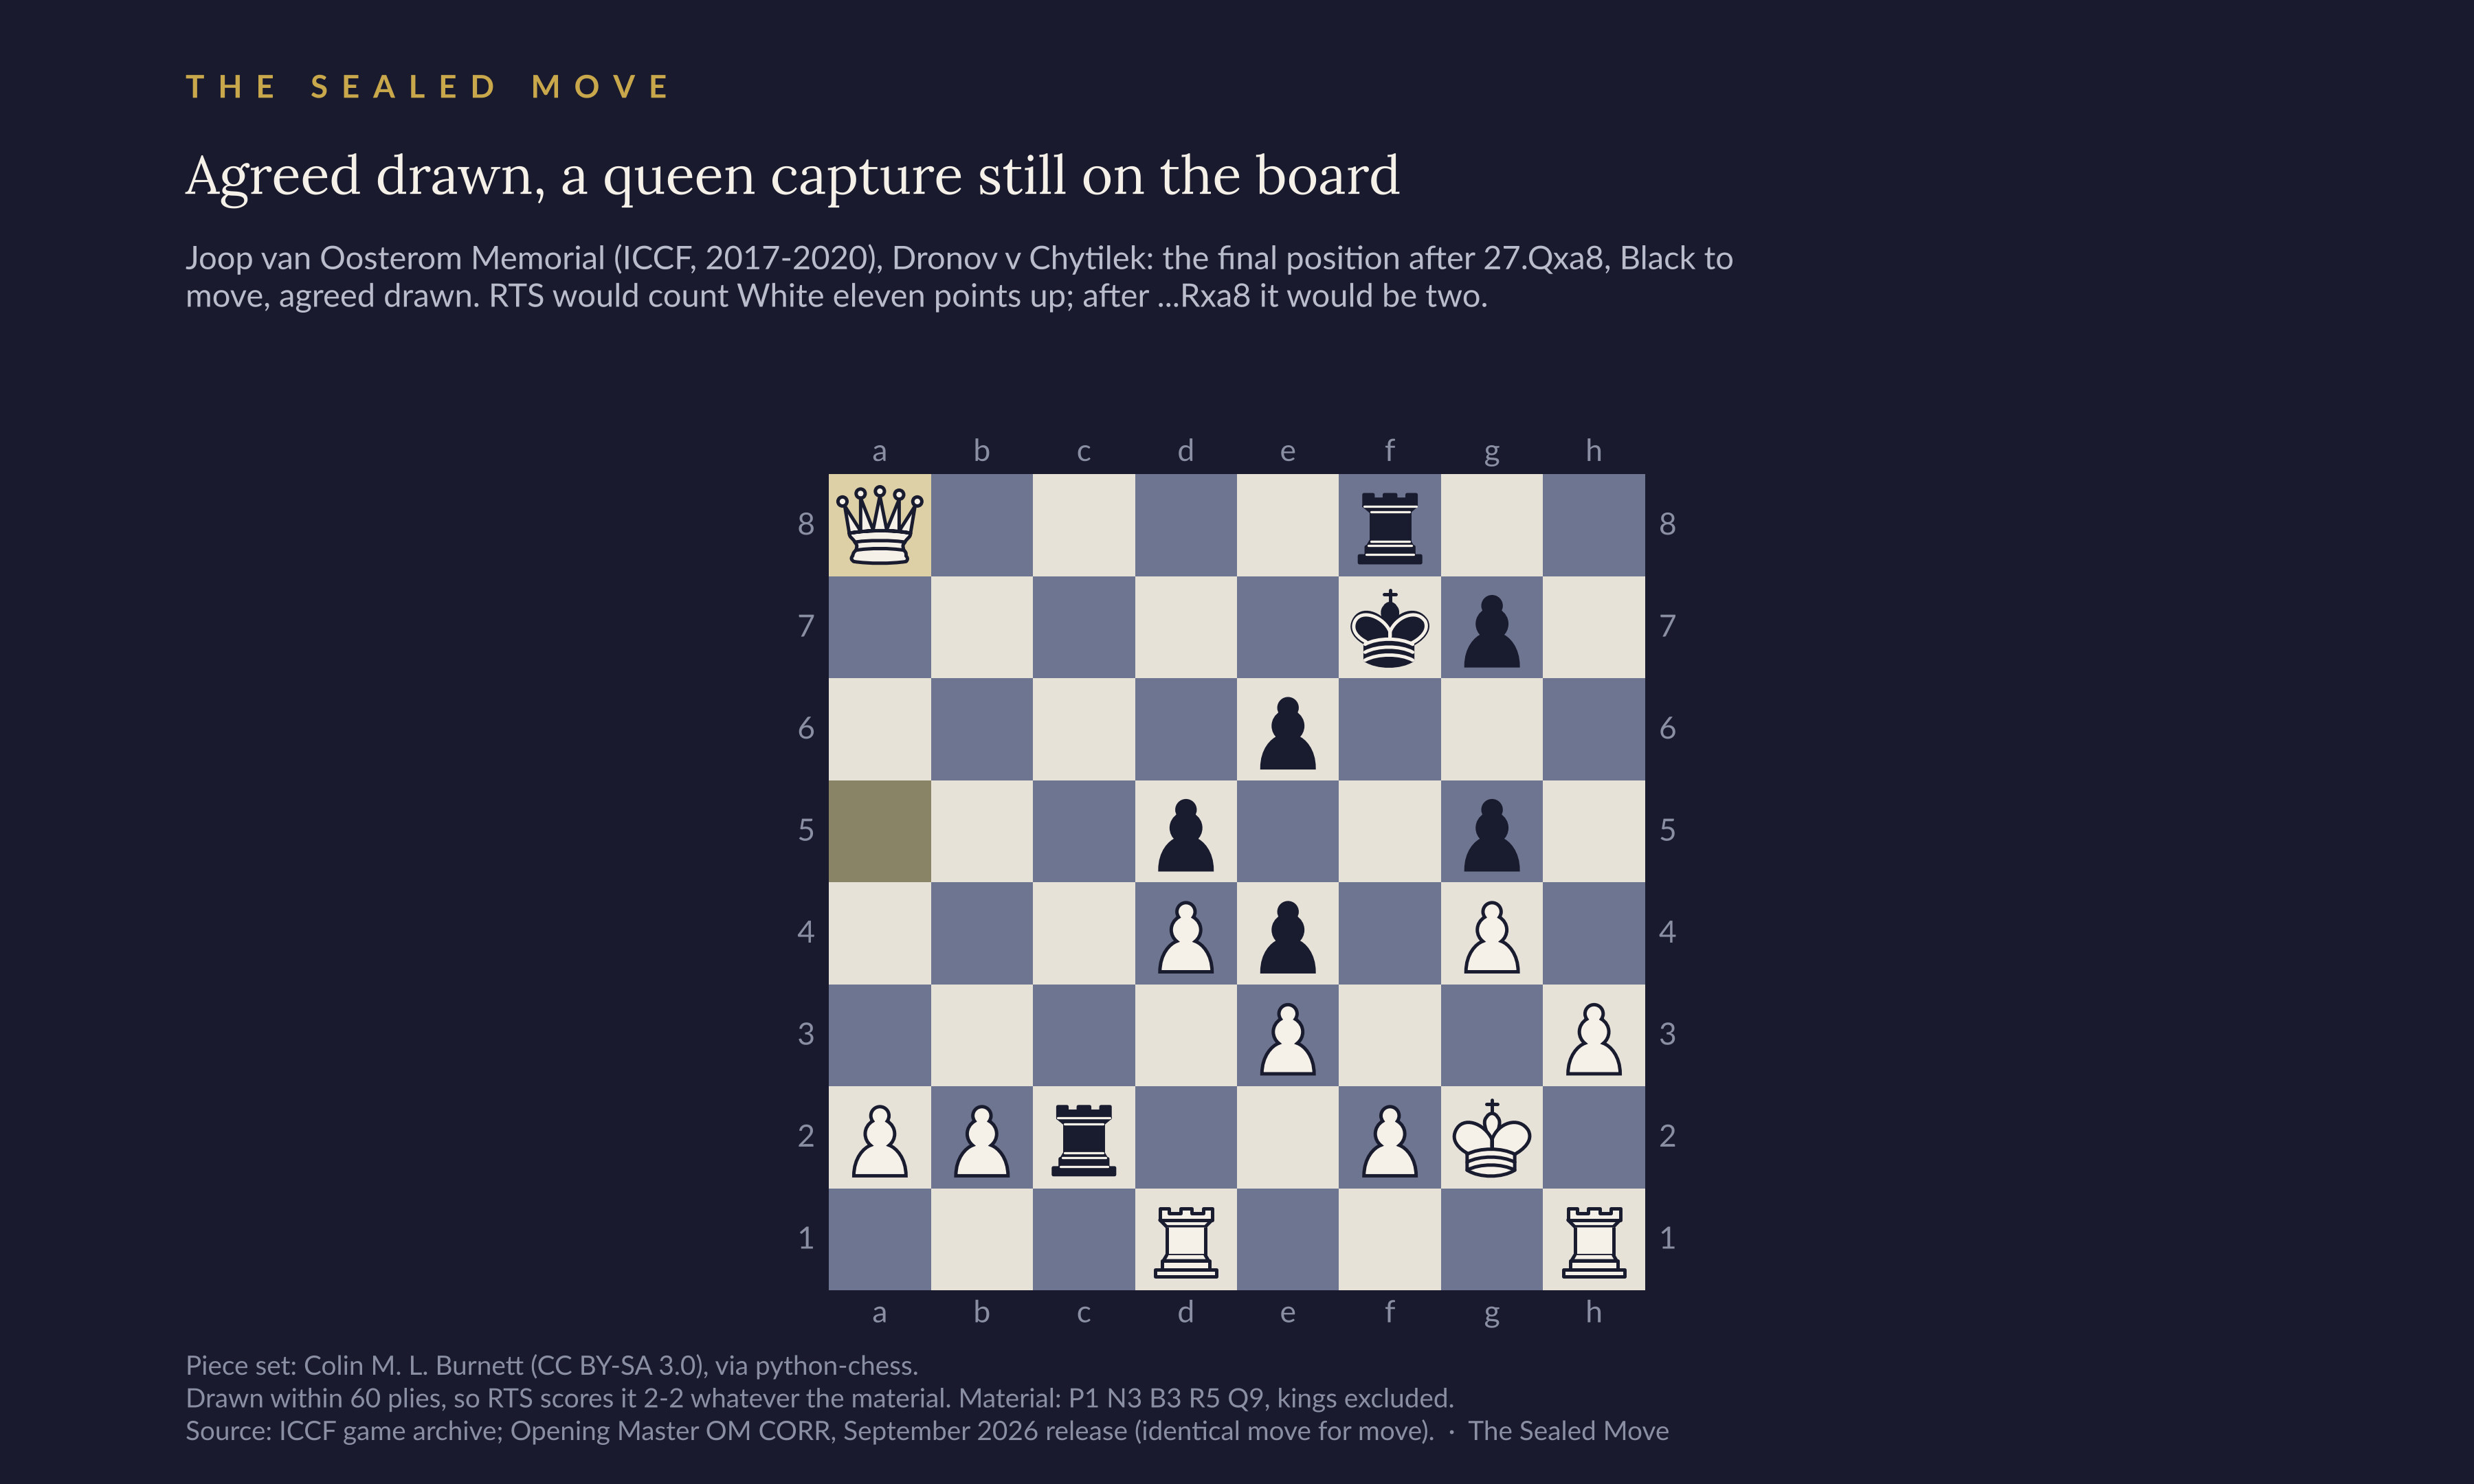
The van Oosterom event has one. Dronov and Chytilek agreed a draw after 27.Qxa8, with ...Rxa8 available. The official ICCF record ends there, as does the database’s; I checked them move by move. Counting as RTS does, White has queen, two rooks and seven pawns against two rooks and five pawns: eleven points up. ...Rxa8, with the rook from f8, is the only capture on a8, and after it the count is two. Because the game ended inside 30 moves, RTS scores it 2–2 regardless. Had the same exchange been interrupted after move 30, RTS would have scored it on eleven points that existed for one move. Neither player did anything wrong. They stopped where they stopped, under a system in which it did not matter.
What it does to the table
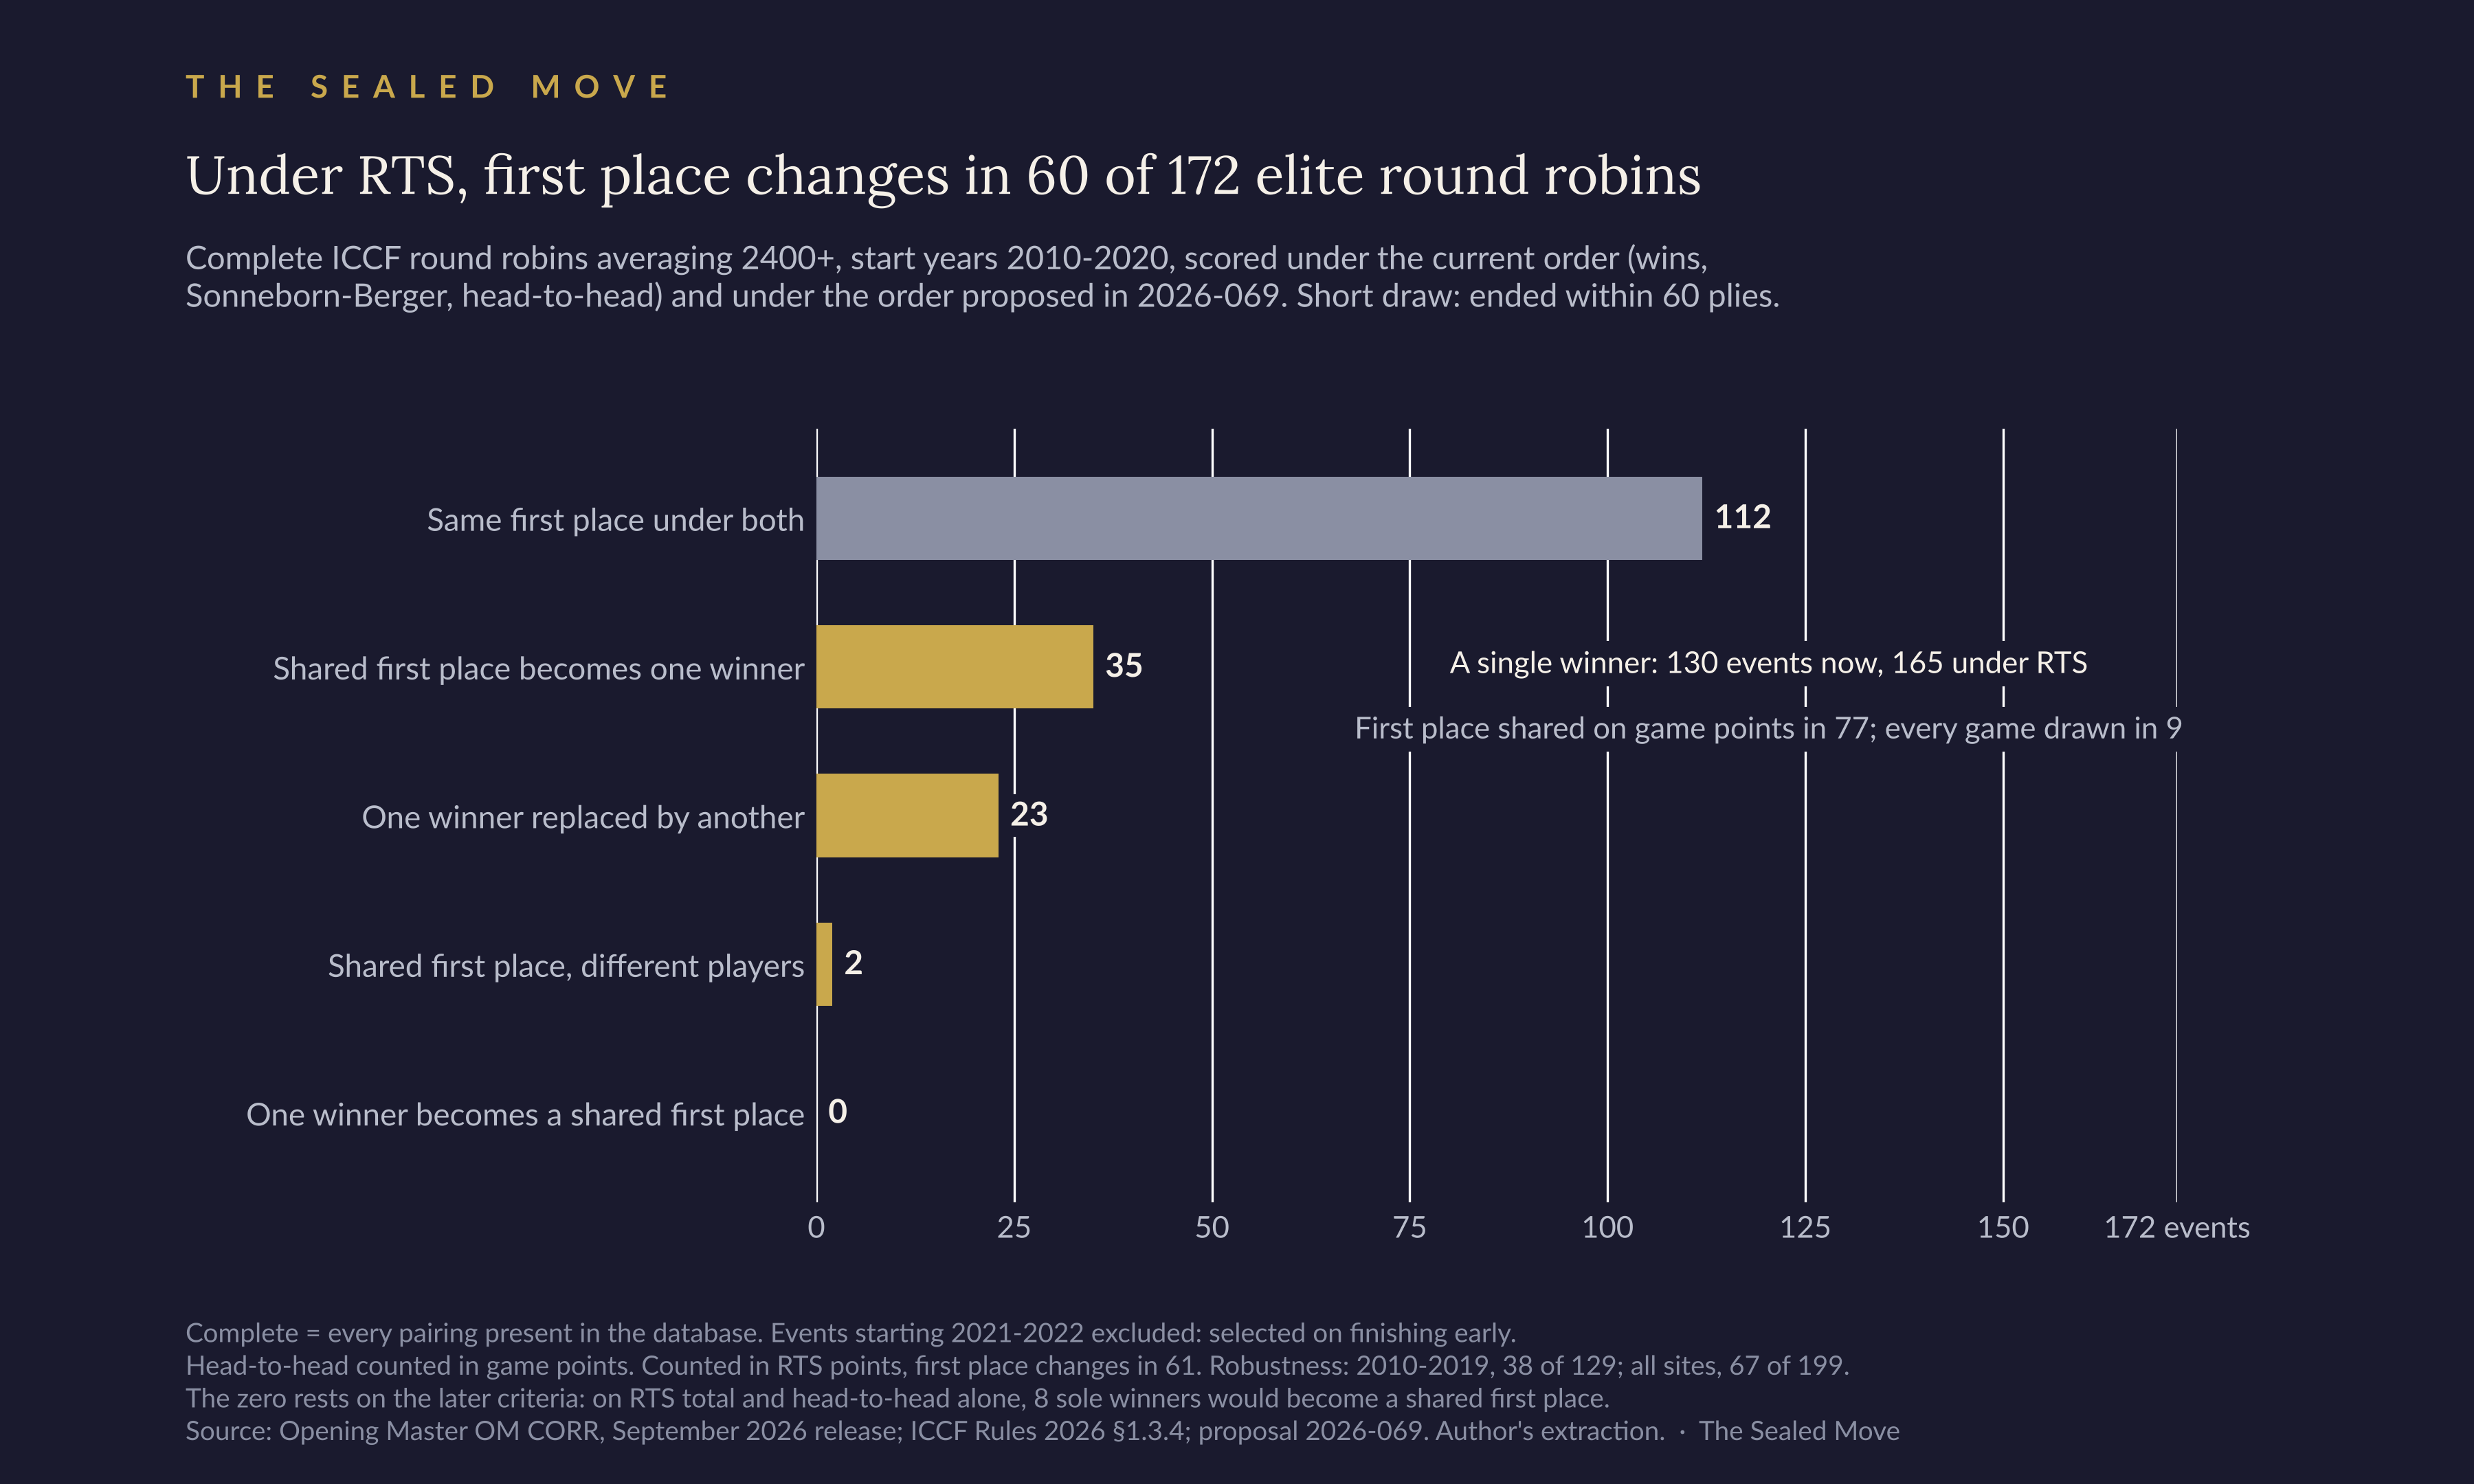
As a tiebreak, RTS works. In 77 of the 172 events, first place was shared on game points. The current order leaves a single winner in 130 events; RTS leaves one in 165. First place changes in 60. In 35 a shared first place becomes a single winner; in 23 the current order picks one player out of a group level on game points and RTS picks another; in 2 a shared first place goes to a different set of players. A tiebreak never touches a player who is alone on game points, so every change happens inside a points tie. One of the 23 is WC40/ct/1, a World Championship candidates section that started in 2020, where three players finished level on points and the top two qualify for the final. Under RTS the two qualifying places would have gone to a different pair.
The margins come almost entirely from draws. For two players level on game points, the RTS difference reduces exactly to the difference in wins plus a count of favoured and disfavoured draws. Across the 60 events, counting each pairing of an RTS winner with a player it displaces once, the margins add up to +473: −3 from wins and +476 from draws. The draw points split by what the favoured draw was. 372 (78%) come from draws whose final position the engine rates level, close to their 81% share of favoured draws generally. 34 come from the side behind checking into a repetition, 26 from tablebase draws, 20 from other repetitions, 17 from draws where the side ahead was at +50 or better, and 7 from draws where it was worse. Across those classes, 100 of the 476 come from draws that ended in the middle of an exchange.
The 1st Interzonal Individual Tournament Final (2020–2022) shows what that looks like in one table. Seven of its 17 players finished on 8.5 points. Under the current order Sitorus won on wins, Jones was second on Sonneborn-Berger, and Pérez López, Heini and Badolati shared third. Under RTS Sitorus still wins. Jones and Biedermann, who was seventh, take second and third, Marbourg rises from sixth to fourth, and the three players level in third fall to fifth, sixth and seventh. The ICCF crosstable notes that the top three placed players each receive an ICCF certificate and medal.
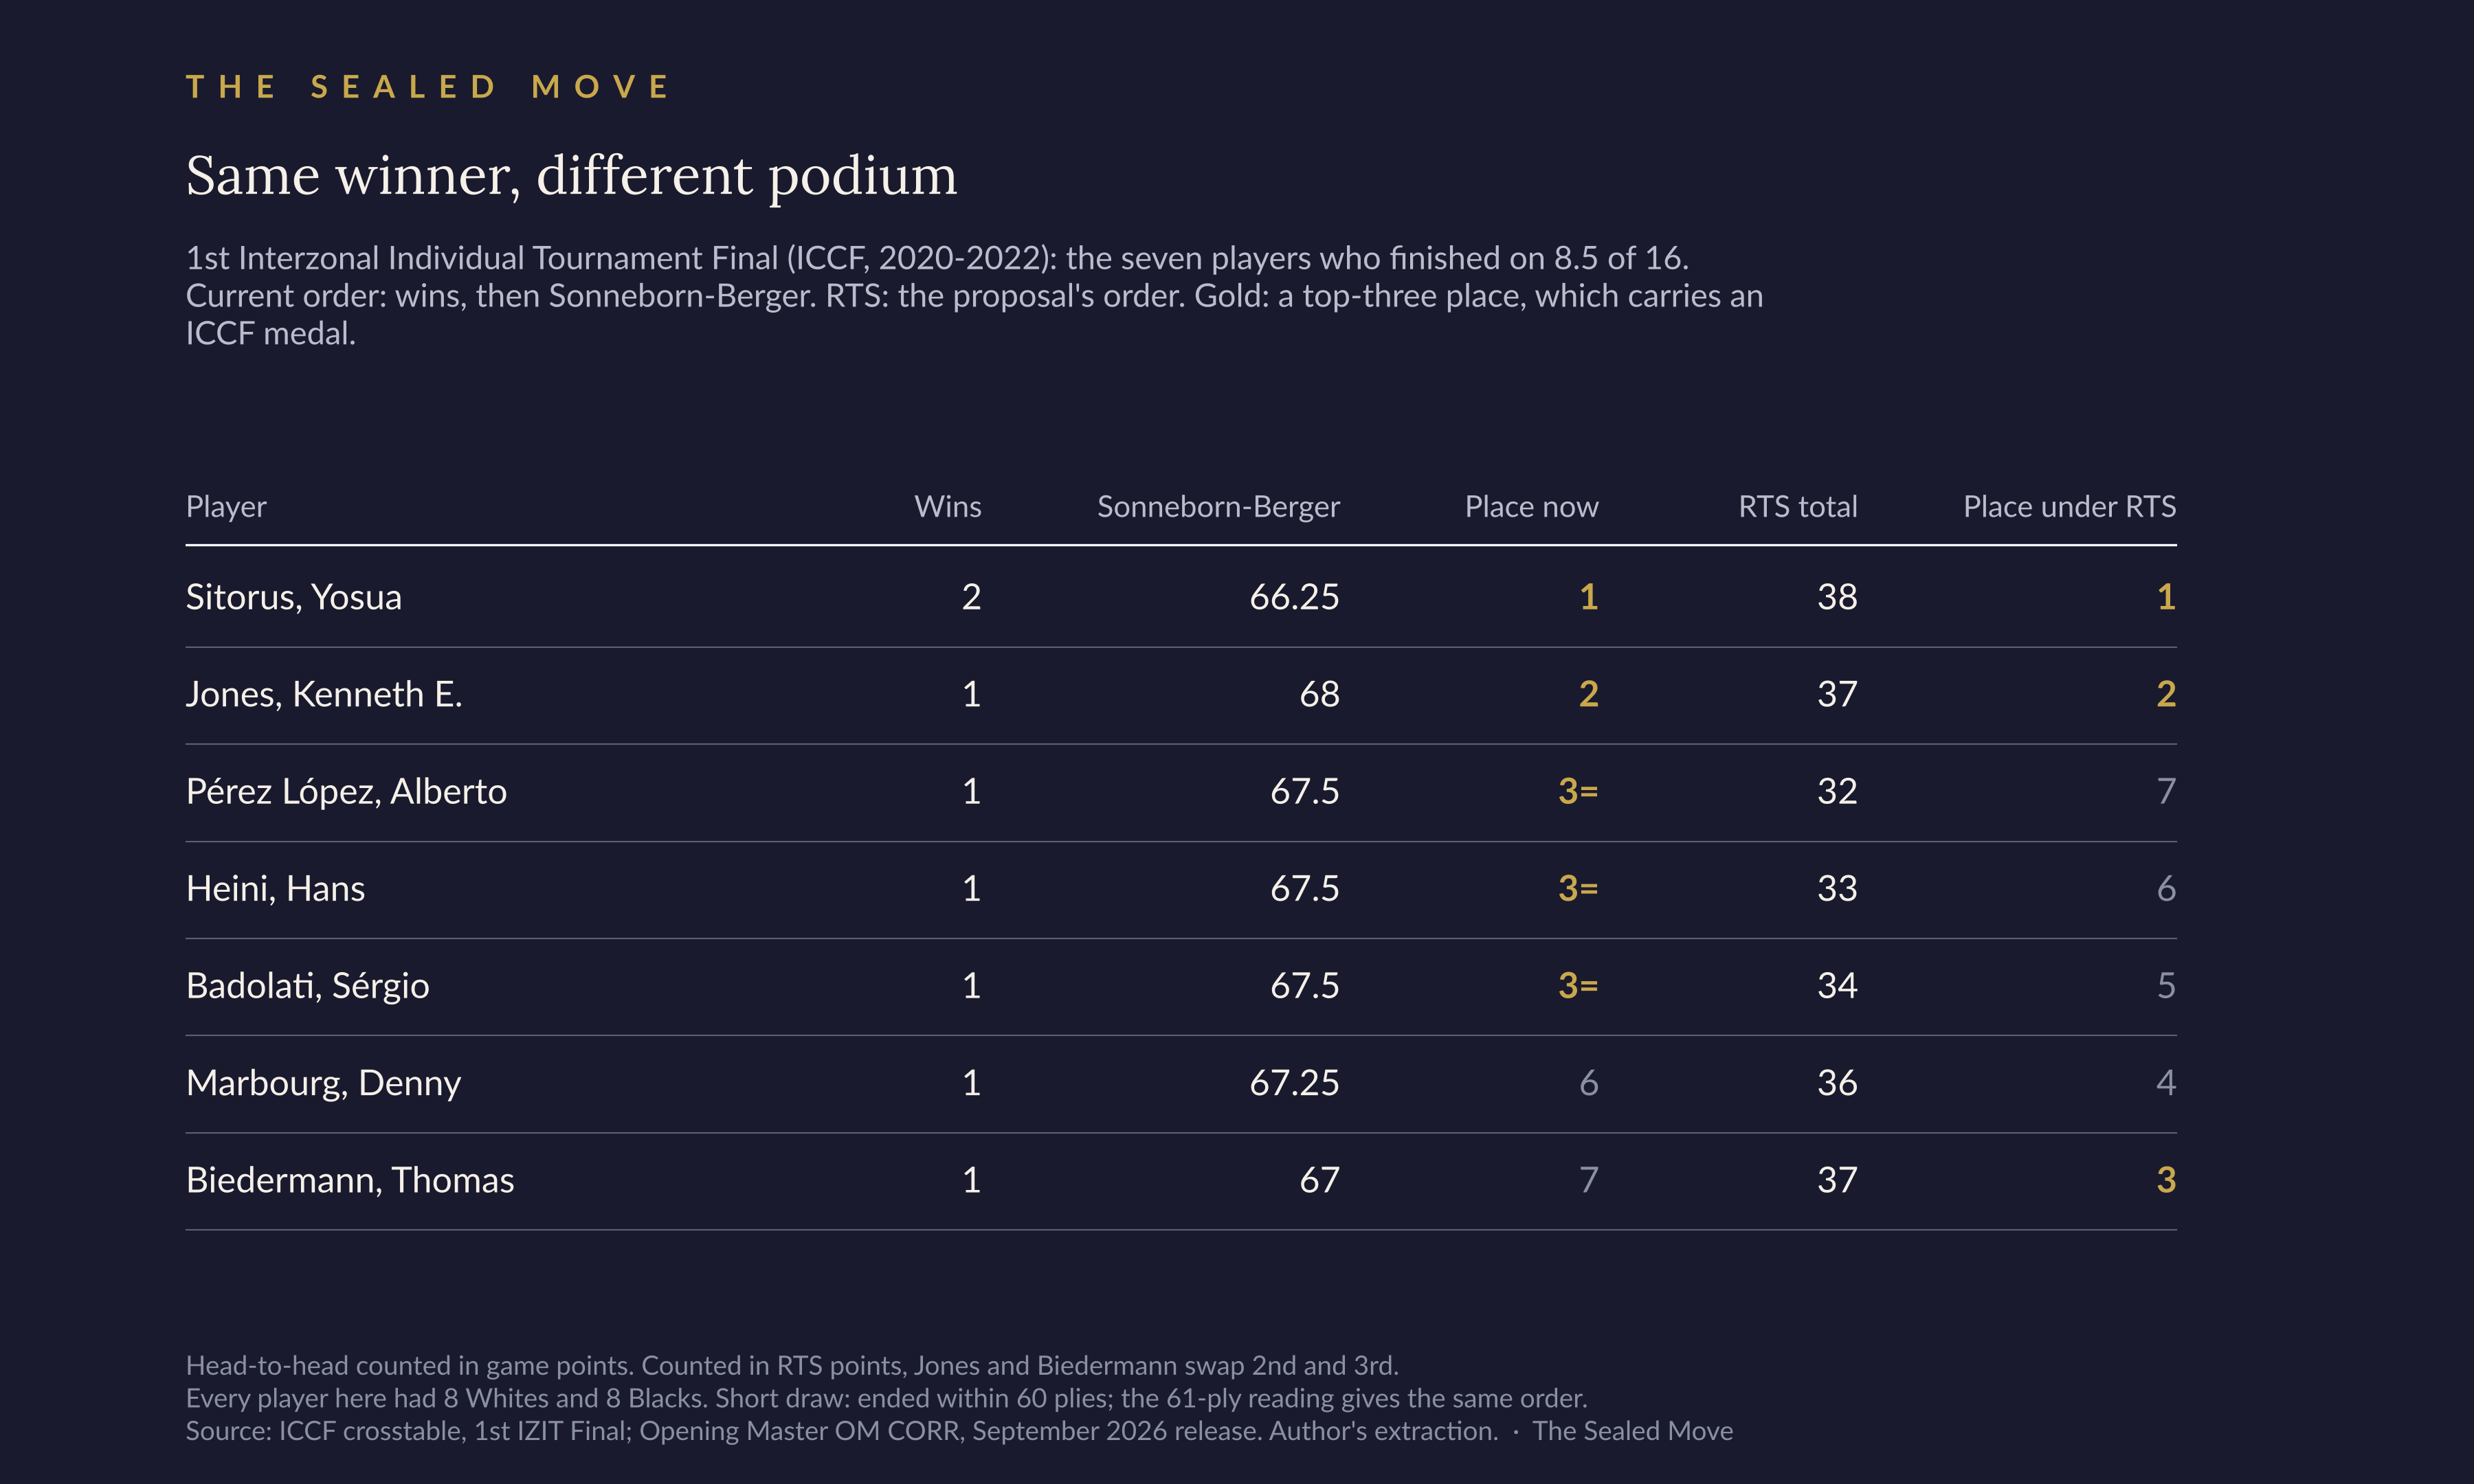
Which of Jones and Biedermann is second depends on a phrase. They are level on RTS total; their own game was a 60-move draw with Biedermann a pawn up. The proposal breaks the tie on “the results of the tied players against one another” and does not say in which unit; elsewhere it calls a draw scored 3–1 a “3–1 RTS result”, so either reading has support in its text. In game points it was a draw, so it falls to Sonneborn-Berger and Jones is second. In RTS points Biedermann won it 3–1 and is second. Across the 172 events the unit decides first place in 5 and changes a place in the top three in 18. The short-draw edge case does similar work: in the van Oosterom event, the reading of “before the 31st move” decides who finishes second behind Dronov. And RTS needs its later criteria more than it appears. After RTS total and head-to-head, first place is still shared in some events, including 8 that have a single winner today. Sonneborn-Berger then decides first place in 10 of them and wins with Black in one; the remaining 7 stay shared.
What it says about players
Is a player’s RTS score something they carry from event to event? Weakly at most. The test I specified in advance, comparing players’ scores per draw in odd and even years of 2016–2020 among the 185 players with at least 20 draws in each, gives a rank correlation of 0.12 (−0.03 to 0.26), which does not rule out zero. Other windows and splits give somewhat higher figures; I report them in the methods and draw nothing from them.
What is clearer is that, in this sample, it shows no relation to rating. Across the same 185 players, the correlation between a player’s RTS score per draw and their rating is −0.02 (−0.16 to 0.12). That rules out a strong relationship among active elite players; it cannot rule out a weak one. Nor does the colour effect show up in who wins: ICCF round robins balance colours almost exactly, and in 22 of the 23 events where one outright winner replaces another, the new winner had the same number of Whites as the old. That is a statement about colour allocation; it does not rule out colour working through which draws went past move 30.
The baseline the trial needs, and the one thing it can’t borrow
Among draws of 2016–2020 between players both rated 2500 or more, 32.0% would have been scored 3–1 (1,313 of 4,099). In the test event so far it is 34.3% (12 of 35), with an interval from 21% to 51%. Those are compatible, and that is all they are. The test event’s 35 are the first games to finish in an event still running, and early finishers are not a sample of a whole event; I dropped events from 2021–2022 from the standings analysis for the same reason. When the trial reports, the comparison should be with its completed events.
In a paper presented to a Reserve Bank of Australia conference in 1975 and published in 1976, the economist Charles Goodhart wrote that any observed statistical regularity “will tend to collapse once pressure is placed upon it for control purposes”. The pressing signal above is exactly such a regularity: in play that ignored final material, the player who ended ahead had been slightly better along the way. RTS puts pressure on final material. Twelve of thirteen players in the test event say they are already playing differently because of it.
So the history can give the trial a baseline, and the trial can run the one test history cannot. Score its completed games the way I have scored these. If the share of favoured draws rises while the pressing edge of the player who ends ahead falls toward zero, that is a warning sign that the rule rewards the pursuit of material more than the pressing it was meant to detect. If the edge holds or grows, the supporters’ case is stronger under the rule than without it. A baseline from other years cannot settle that on its own; the comparison that would is with non-RTS events of the same category played over the same period, ideally with some of the same players. The mid-exchange share is worth watching too: a player about to be scored 1–3 has a new reason to recapture before agreeing, and that is a change the rule would have caused for the better.
I am happy to hand the baseline figures to the trial, by rating band and window, so that its report to next year’s Congress has something to measure against.
Two drafting fixes cost nothing and should come first. Say whether “before the 31st move” includes a draw agreed after White’s 31st move. Say whether the results between tied players are counted in game points or RTS points. On the evidence of these 172 events, each reading decides real places, including medals.
What I can say without waiting for the trial is narrower than I expected when I started. Applied to five years of elite draws and a decade of elite round robins, RTS finds a real signal. The player who ends a pawn up was, on average, a little better along the way. The signal is small, and the scoring around it is noisy. Two draws in five never reach it. One favoured draw in six is scored at the moment of a capture its opponent could have reversed. Its total shows no relation to rating in this sample. Whether that is a good enough basis for separating eight grandmasters who drew all their games is a judgement for the delegates. I would want the trial’s own games to answer the Goodhart question before deciding.
SIM Paweł Fiedor
Methods
Data. Opening Master OM CORR, release om_corr_2026_09, exact duplicates removed. Chess960 excluded by Variant tag. Both players rated, and banded on the lower rating, so 2400+ means both players at least 2400. Years are start years; the corpus has no finish dates. The primary window is 2016–2020, chosen by a rule fixed before the data were read, after games starting in 2022 were found to be still arriving in long, non-short form. 2018–2022 is reported throughout as a sensitivity. Each game’s rating is the Elo carried in its tags; which list and which date those refer to the data do not identify.
Short draws. Primary reading: the game ended within 60 plies. Alternative: within 61 plies (a draw after White’s 31st move). An earlier version of this analysis used 62 plies as the alternative, which no reading of the rule supports; it is withdrawn.
Engine and tablebases. Stockfish 19, one thread, 1,024 MB hash, ucinewgame before each position. Final positions at 500,000 nodes; a seeded 800 re-searched at 50,000,000 nodes (median depth 22 against 61). The path test at 100,000 nodes from ply 30, pre-registered before the sample was drawn. Syzygy 3–6 men complete, 7 men partial. Scores read with the engine’s own perspective for the side named (score.pov), never negated by hand; Black’s figures are therefore from Black’s side, and negative where White’s first-move edge persists.
Classification of favoured draws, applied in order: tablebase draw; checking into a repetition (the final position recurred and the side with less material gave check on each of its last three moves); other repetition; then the engine score at +50 or better, between −50 and +50, or −50 or worse. An alternative screen requiring checks on the last six moves of the side behind gives 69 rather than 284.
Standings. Complete round robins are those with every pair present in the database; that is completeness as recorded in OM CORR, not against ICCF’s official entrant lists. The three events named in the piece were checked against their ICCF crosstables and all three agree; van Oosterom shows how the two can differ (a ninth entrant whose games were cancelled is absent from the database and from ICCF’s scores alike). Events on remoteschach.de, LSS and FICGS are excluded from the primary population (27 events; including them changes first place in 67 of 199). Events starting in 2021–2022 are excluded because they are selected on finishing early. Robustness: 2010–2019, 38 changes in 129 events; 2010–2018, 23 in 82. The van Oosterom (ICCF event 68635), 1st IZIT Final (event 84757) and WC40/ct/1 (event 87718) crosstables, at iccf.com/event?id=<number>, were checked against ICCF, including the qualification and medal notes printed on them; all 28 van Oosterom games, and the diagram games, match ICCF’s PGN move for move.
Path test. Pre-registered before the sample was drawn. 1,000 favoured and 1,000 level non-short draws at 2400+, 2016–2020, drawn by a seeded rule; every position after ply 30 searched at 100,000 nodes and read from each side’s own perspective with the engine’s score.pov. Per-game metrics, so each game counts once; differences and intervals by bootstrap over games (2,000 resamples), within colour. The 100k test is the pre-registered primary. The 2M rerun of all 110,896 positions (median depth 25, against 15) had the same reading fixed in writing before the full run started; 11,906 of its positions (10.7%) had already been searched at 2M in an earlier robustness subset whose results had been seen, which the pre-registration’s wording does not disclose and I do here. Event-clustered intervals (512 events) are almost identical. Robustness at 100k, all holding the reading: a common window of plies 31–80; games matched on length within four plies (White, share +4.9 points, +2.4 to +7.3; Black +4.0, +2.3 to +5.9); and only positions before the final material edge was acquired. Favoured draws run a few plies longer (median 51 and 50 plies after ply 30, against 46). How much of the 2M shrinkage is the engine’s scores compressing with depth was examined after the fact: for Black it is consistent with compression alone; for White the edge shrinks by more than that, and stays above zero on a scale-free measure. The “held unbroken” measure tracks the RTS material count after every ply from ply 30 and records the earliest ply after which its final sign never changed; it is censored at ply 30.
Sensitivity. On 2018–2022 the headline shares are: short 39.5% of elite draws, favoured 51.2% of the rest, tablebase draws 8.8% of favoured draws, the side behind checking into a repetition 4.4%, engine-level 80.5%. The player-persistence correlation in other windows is 0.36 (2018–2022), 0.16 (2010–2020) and 0.28 (2010–2022); averaged over every balanced split of years, 0.26 to 0.34. None of these is a pre-specified test.
Players are identified by normalised name. A bare surname can merge two players, and an inconsistent spelling can split one.
Anomalies. 25 stalemates with large material differences, 12 draws of ten plies or fewer, and two favoured draws scored above +300 were checked; removing them moves no headline share by more than 0.13 points.